Giving insight into the history of a design process can establish a shared understanding and the collection of feedback, which ultimately results in moments of reflection (Sterman et al., 2023). Through the documentation, stories about the process, rationales and milestones can be constructed, that can be used to communicate the process to stakeholders (Sharmin & Bailey, 2013)). Therefore, the concept should aim for reconstructing the rationales and activities of the design process.
The Traceable Design System
Integrating Design Rationale into Design Systems
The documentation of design decisions is a common practice across various disciplines to capture the decision-making process and promote reflection on the decisions made. Design systems are becoming an increasingly prominent tool for documenting such design decisions. This research project explores the extent to which the incorporation of design rationale into design systems can facilitate the traceability of design decisions.
Role
UX & Visual Designer, Researcher
Timespan
February - August 2024
Context
Master Thesis
Keywords
Design Systems, Design Research, Prototyping, Interview Study
There's more to it
This article only scratches the surface of the thoughts and actions behind what was realised in the project. Let's talk if you're interested in more details!
Last updated: 02.12.2024
Motivation
In the field of user experience design, the utilization of Design Systems is a commonly favored approach to document design. In design departments of companies, for example, design systems are used to communicate and establish a shared understanding of the design language throughout several designers. However, this type of documentation usually represents the current state of the design and lacks of information about the design process and its design artifacts, including the steps and knowledge that informed the final design decision. The use of design systems in their contemporary definition represents a first step, but only scratches the surface when it comes to capturing the entirety of design processes in a traceable manner.
This project further explores the design systems approach, investigating the potential
for enhancing the structure of design systems to facilitate more traceable and transparent
documentation of design processes. To this end, it will be discussed how the concept of
design rationale can be applied to the field of interaction design.
Research Question 1
How are design processes structured and what outcomes should be documented
to facilitate the traceability of design decisions?
Jump to Section
Research Question 2
How can design rationales for interaction design decisions be structured in a
systematic way?
Jump to Section
Research Question 3
How can an design system interface be designed that not only guides interaction
designers in documenting design decision rationales, but also presents those rationales
and the design process in a traceable way?
Jump to Section
Another two research questions addressed the evaluation of the concept in terms of useful guidance and the extent of promoted traceability of design decisions.
Procedure
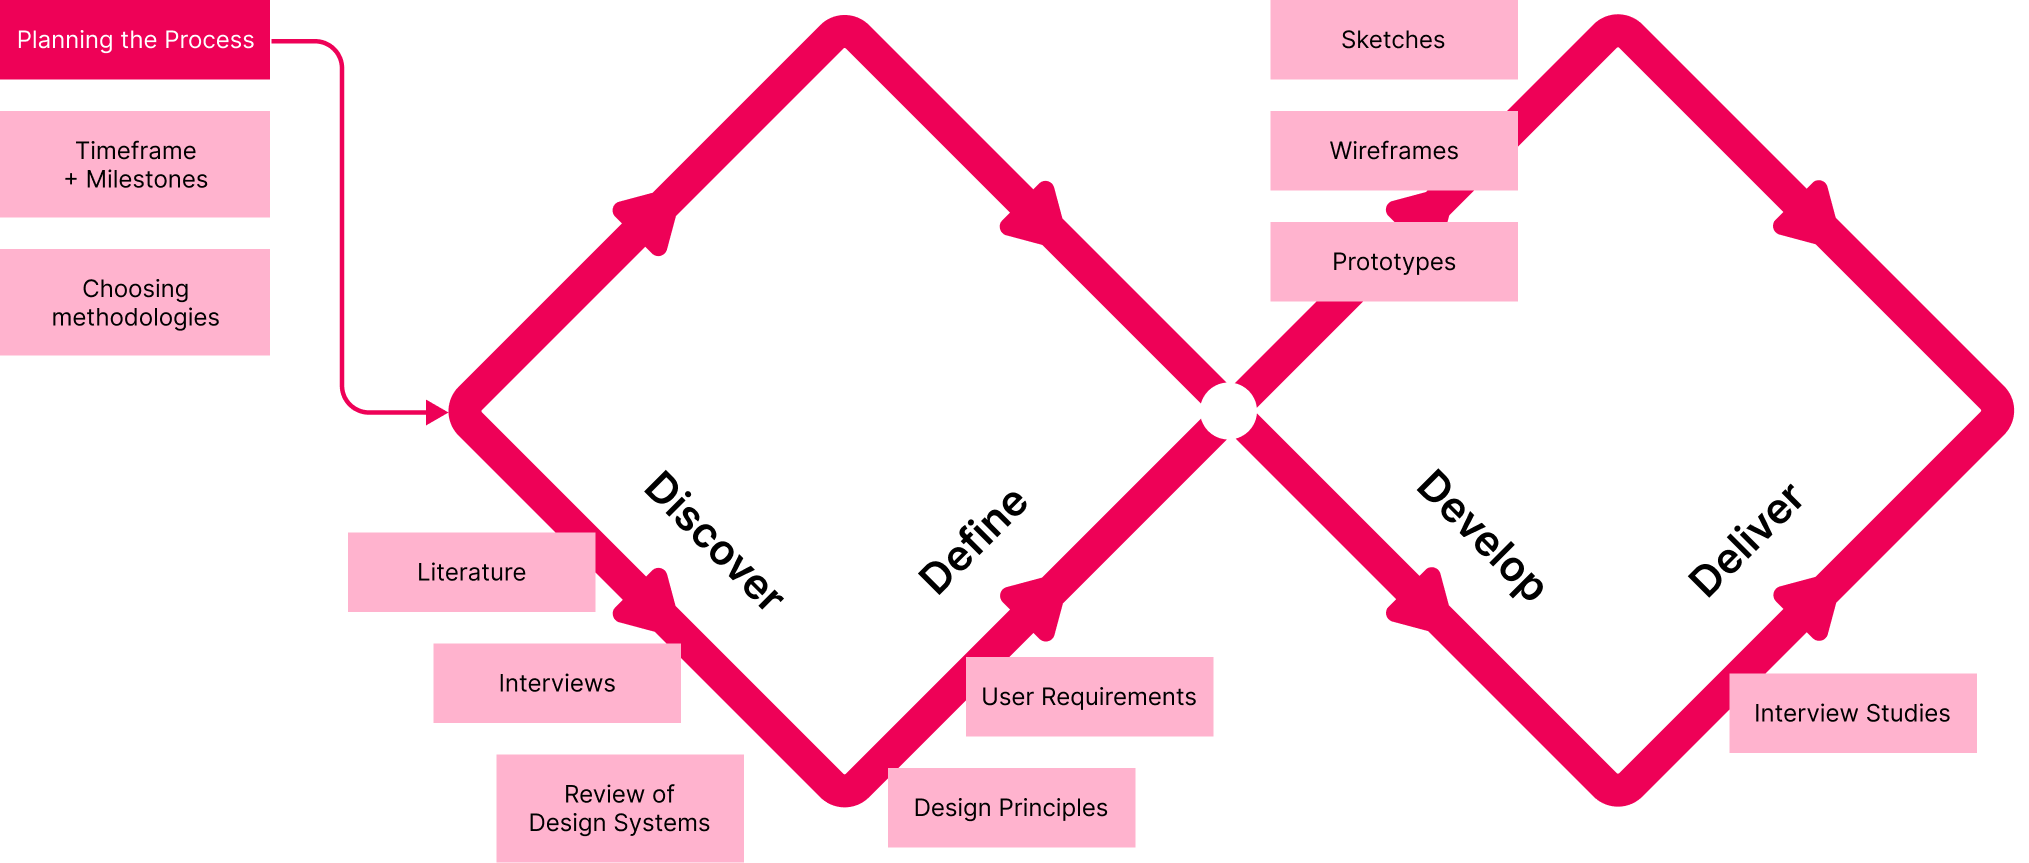
The procedure for this project is inspired by the Human-Centered Design Process and the Double Diamond Design Process.Additionally, the design process was carried out in two iterations in order to be able to evaluate interim results and adapt both requirements and design in a further iteration.
Research
Design Systems
When it comes to documenting and presenting design decisions, the usage of a Design System (DS) is an increasingly favored approach in the industry (Lamine & Cheng, 2022). Albeit there is no universal definition of what a design system should comprise, Fessenden (2021) summarizes the concept as ”a set of standards to manage design at scale by reducing redundancy while creating a shared language and visual consistency across different pages and channels”.
In order to gain a deeper understanding of the extent to which traceability
already plays a role in the implementation of design systems, different design systems (N = 10) were reviewed.
The following features and information were identified:
Changelogs (N = 8) – The changelogs in the reviewed design systems outlined the changes made to the design in text form, some also included images showcasing the modifications made
Blogs (N = 5) – Similar to changelogs, blog posts were used to inform about changes made to content of the design system or for tutorials on how to use the design system
References (N = 4) – Linking other resources (e.g., articles or discussions) whenever it had impact on the design decisions made
Status tables or checklists (N = 4) – The checklists showed the status of the component, for example, whether accessibility tests have been carried out, or whether the component is available to developers on certain development environments. They provide insight into the design process by indicating if certain steps have been carried out
The review revealed that design system teams are already trying to make design modifications visible through a diverse set of features. However, in the design systems reviewed, the documentation and highlighting of selected changes were prioritized, rather than the outlining of the design process behind the decisions made. Design rationales were rarely conveyed and if so, they were only available to explain curated decisions.
Design Rationale
Documentation often only represents the description of the final outcome of the process itself, rather than including the thoughts and decisions that were considered throughout the decision-making process (Burge & Brown, 2000). In response to this need, the concept of Design Rationale (DR) has received considerable attention within the field of engineering. DR can be defined as a historical record of the decision-making process that resulted in the selection of a particular option (Lee & Lai, 1991).
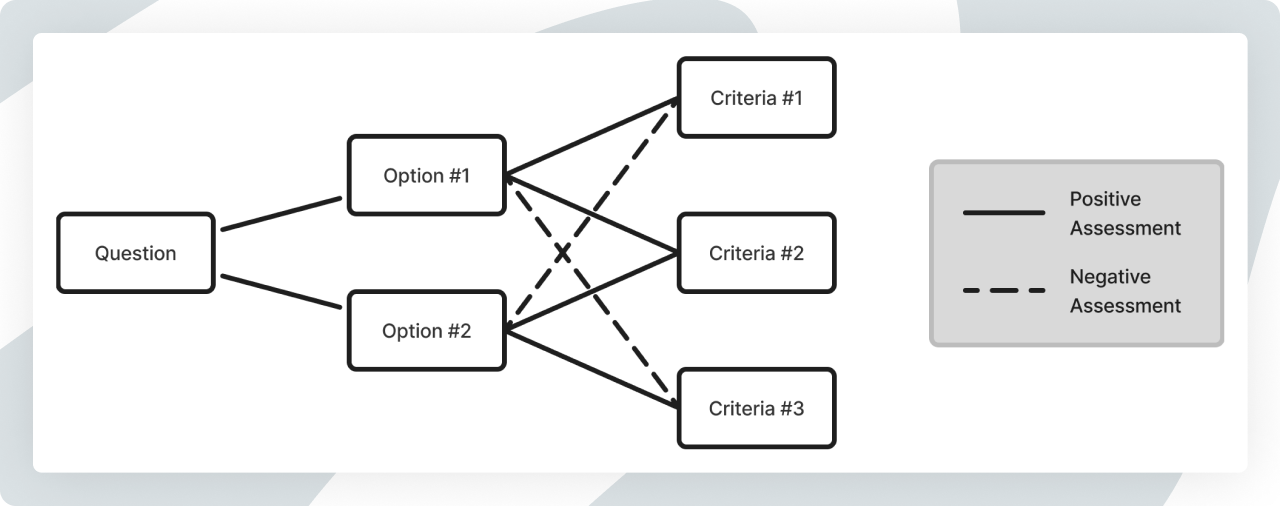
MacLean et al. (1991) introduced a semi-formal structure with the Questions, Options,
and Criteria (QOC) notation, which represents design rationale by capturing the
design space. As the name implies, it consists of three components: (1) questions, which
reproduce the problem statement, (2) options, which comprise design alternatives, that
were considered to answer the questions, and (3) criteria that help choose the final option.
Architectural Decision Record
Architectural Decision Records (ADR) are becoming a standard practice in the software industry to make design decisions accessible. Through offering a template for the capturing of design decisions, ADRs provide structure and guidance to authors in the process of creating documentation (Keeling, 2022). Additionally, it allows for decision socialization, where the entire team collectively reflects and agrees upon the decision made, rather than individuals acting in isolation (Perkins, 2020).
Nygard (2011) suggests a five-part template for ADRs:
Title – A short document name
Context – A description of the context the decision is located in. This might be articulated as a problem statement
Decision – This part includes a description of the final decision that was made and chosen
Status – This indicates the status of a decision. For example, proposed, accepted or deprecated
Consequences – In this section, the resulting changes to the context through the decision must be stated. This includes both positive and neutral consequences, as well as those with negative tendencies
Design Reflection
Reflection can be seen as a ”cognitive process that allows a designer to develop new insight into her design, generate alternative solutions, and reframe the design problem” (Sharmin & Bailey, 2013). This is particularly relevant in the context of design, where a potential barrier to the creative process can be design fixation. It is defined by Jansson and Smith (1991) as ”blind adherence to a set of ideas or concepts limiting the output of conceptual design”. Fixation can occur when a designer or team only considers a few design concept and fails to include new knowledge (Youmans & Arciszewski, 2014). Reflecting on the design process can then help to unveil facilitators of design fixation as knowledge and concepts are being revisited.
However, the degree of reflection may vary depending on the specific task and context in question. Fleck and Fitzpatrick (2010) present a five-level categorization of reflection.
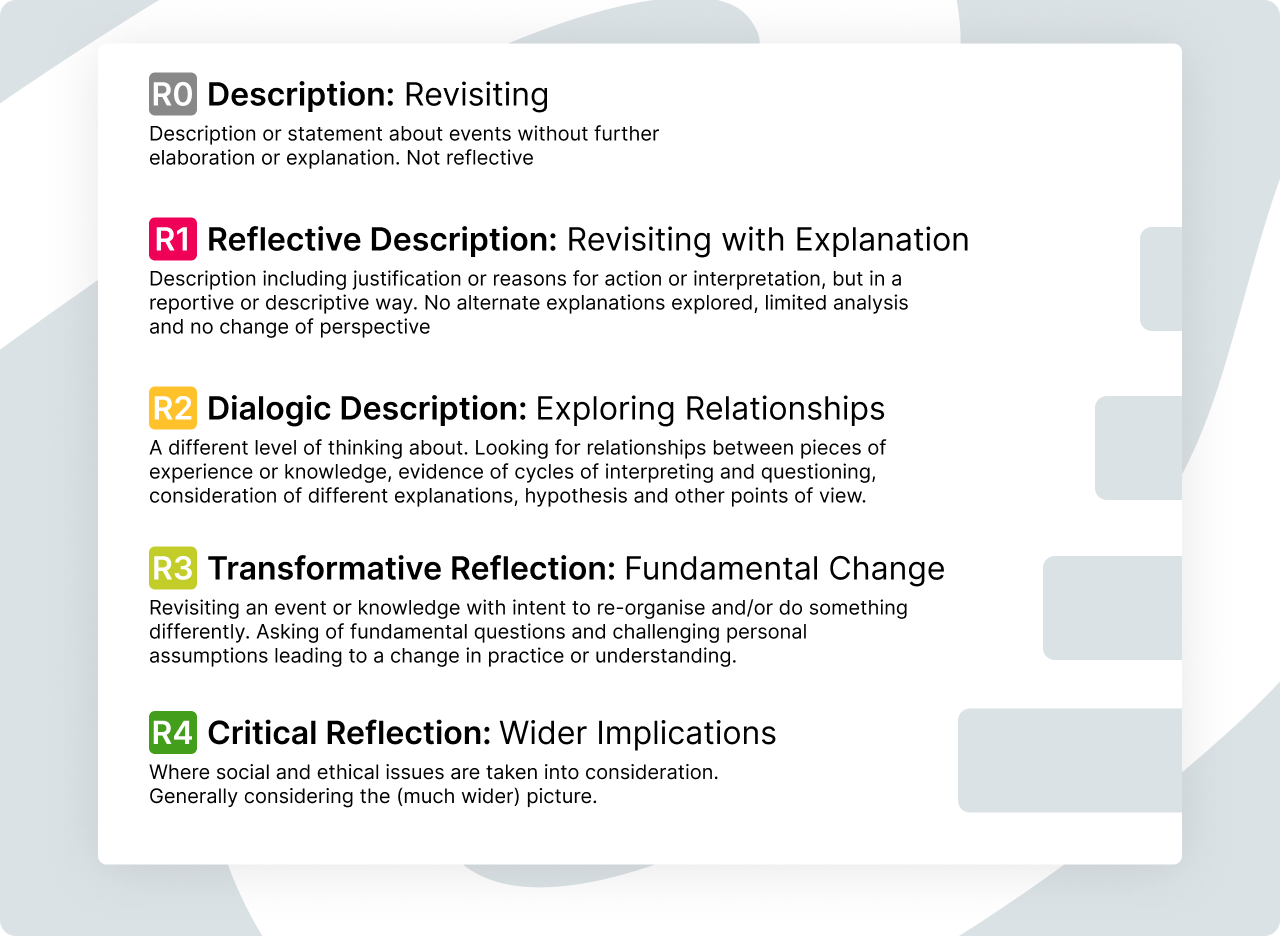
This adds to the conceptualization of reflection as a learning progression, whereby knowledge is reprocessed and results in the generation of further knowledge (Baumer, 2015).
Design Principles
The requirements and context analysis resulted in four design principles, that were considered throughout the conception phase.
There are only a few tools dedicated to the documentation of design activities (Dalsgaard & Halskov, 2012), resulting in designers develop their own documentation strategies and utilizing tools that are not originally intended for this purpose (Rasmussen et al., 2020). This leads to the unavailability of design artifacts to other designers. However, as knowledge from prior projects can be seen as a source of inspiration to generate ideas (Sharmin et al., 2009), the concept to be developed should allow for the revisiting of one’s own artifacts and exploration of the artifacts created by others (Khan et al., 2020).
In Kaleidoscope, Sterman et al. (2023) demonstrate how the capturing of design artifacts can lead to reflection on design activities. Dalsgaard & Halskov, 2012 discuss how the disclosure of the design process not only encourages the individual reflection, but also shared reflection among designers, establishing a foundation for discussions. Additionally, prevalent design systems are already incorporating features that provide information regarding modifications made to components. The concept should build on these very first approaches on making design decisions more traceable. This principle enforces the fourth research question.
Other disciplines have shown that it is possible to guide through documentation processes by providing, thereby making it accessible to professionals of varying levels of experience (e.g., Keeling, 2022; Nygard (2011)). However, due to the lack of standardized design documentation processes, the design field is missing anchor points for the capturing and formatting of design decisions (e.g., Rasmussen et al. (2020)). To address this issue, the interface concept should provide guidance on how to capture design rationales. This principle enforces the fifth research question.
First Iteration
Conception Phase
As part of the conception phase, it was not only necessary to develop a visual design for the interactive prototype, but also a theoretical framework for capturing design rationales, which could then be applied to the interface. The outcomes of both steps are presented in the following sections.
Design Rationale Framework
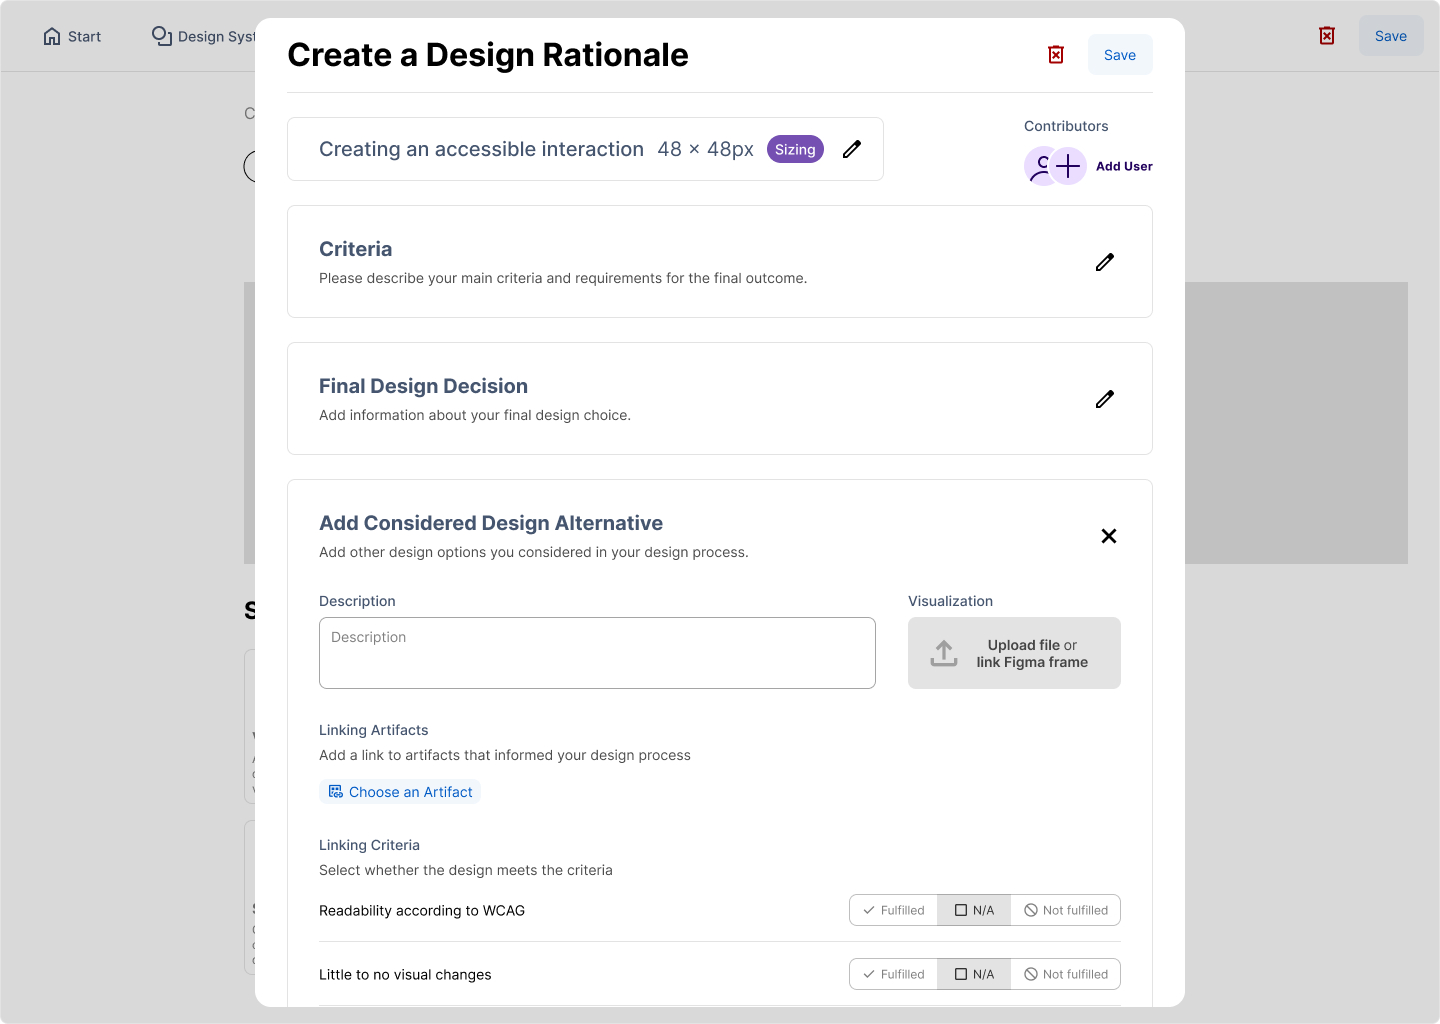
The simple structure of ADR templates enable software architects to document rationales by giving a clear guidance. As ADRs are successfully widely adopted in software architecture, a template for capturing design rationale was composed based on the approaches of Nygard (2011) and Kopp et al. (2018). This resulted in a template for capturing design rationale, comprising six fields.
Problem statement — A short description of the problem that needs to be solved. This can also be the objective of the decision-making process, defined as a statement or question
Contributors / Actors in the Decision-Making — In this field, the decision makers should be specified in order to record those responsible for the decision and to be able to identify contact persons, as design work is highly collaborative (e.g., Feng et al., 2023).
Considered Design Options — The addition of considered design alternatives allows for the retracing of thoughts and experiments throughout the design process. For example, the lack of design options may be an indicator for design fixation.
Final Design Decision — The final design decision needs to be documented, of course. This may take the form of a descriptive text, images, explicit design properties or other forms of artifacts.
Related Artifacts — The linking of artifacts that are associated with the decision helps to retrace the decision-making process, including all influencing factors.
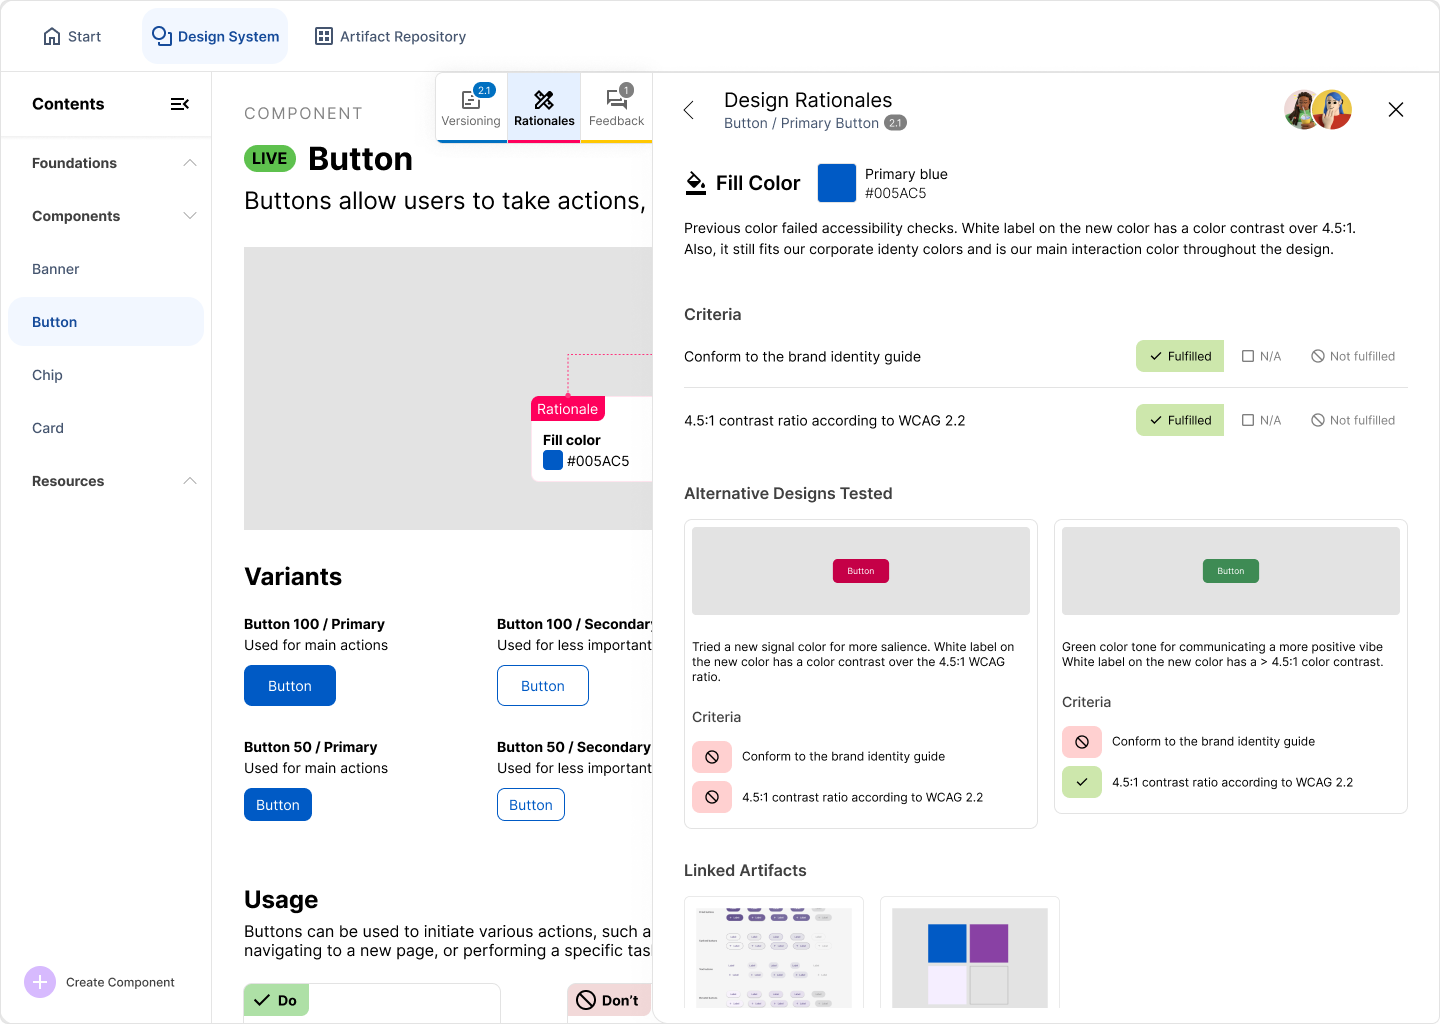
Criteria — The criteria that the final decision should ideally fulfill are described here. For each considered design option and the final decision, it needs to be evaluated whether the criteria are met in each case. This not only allows the options to be compared on the basis of the criteria, but can also form the basis of discussions ( MacLean et al. (1991)).
Design Procedure
For the generation of design ideas, the Crazy 8’s method was used. The original proposal for this method is to sketch eight ideas in eight minutes. However, further approaches were designed outside the eight minute time frame. The aim of this was to have a wide range of potential solutions on which can be build on.
After sketching and wireframing, some of the designs were converted into low-fidelity designs. Their pros and cons were weighed up against each other and fitting solutions identified. These were then implemented as high-fidelity concepts in Figma and later integrated into the interactive prototype, which acts as the main source for the evaluation phase.
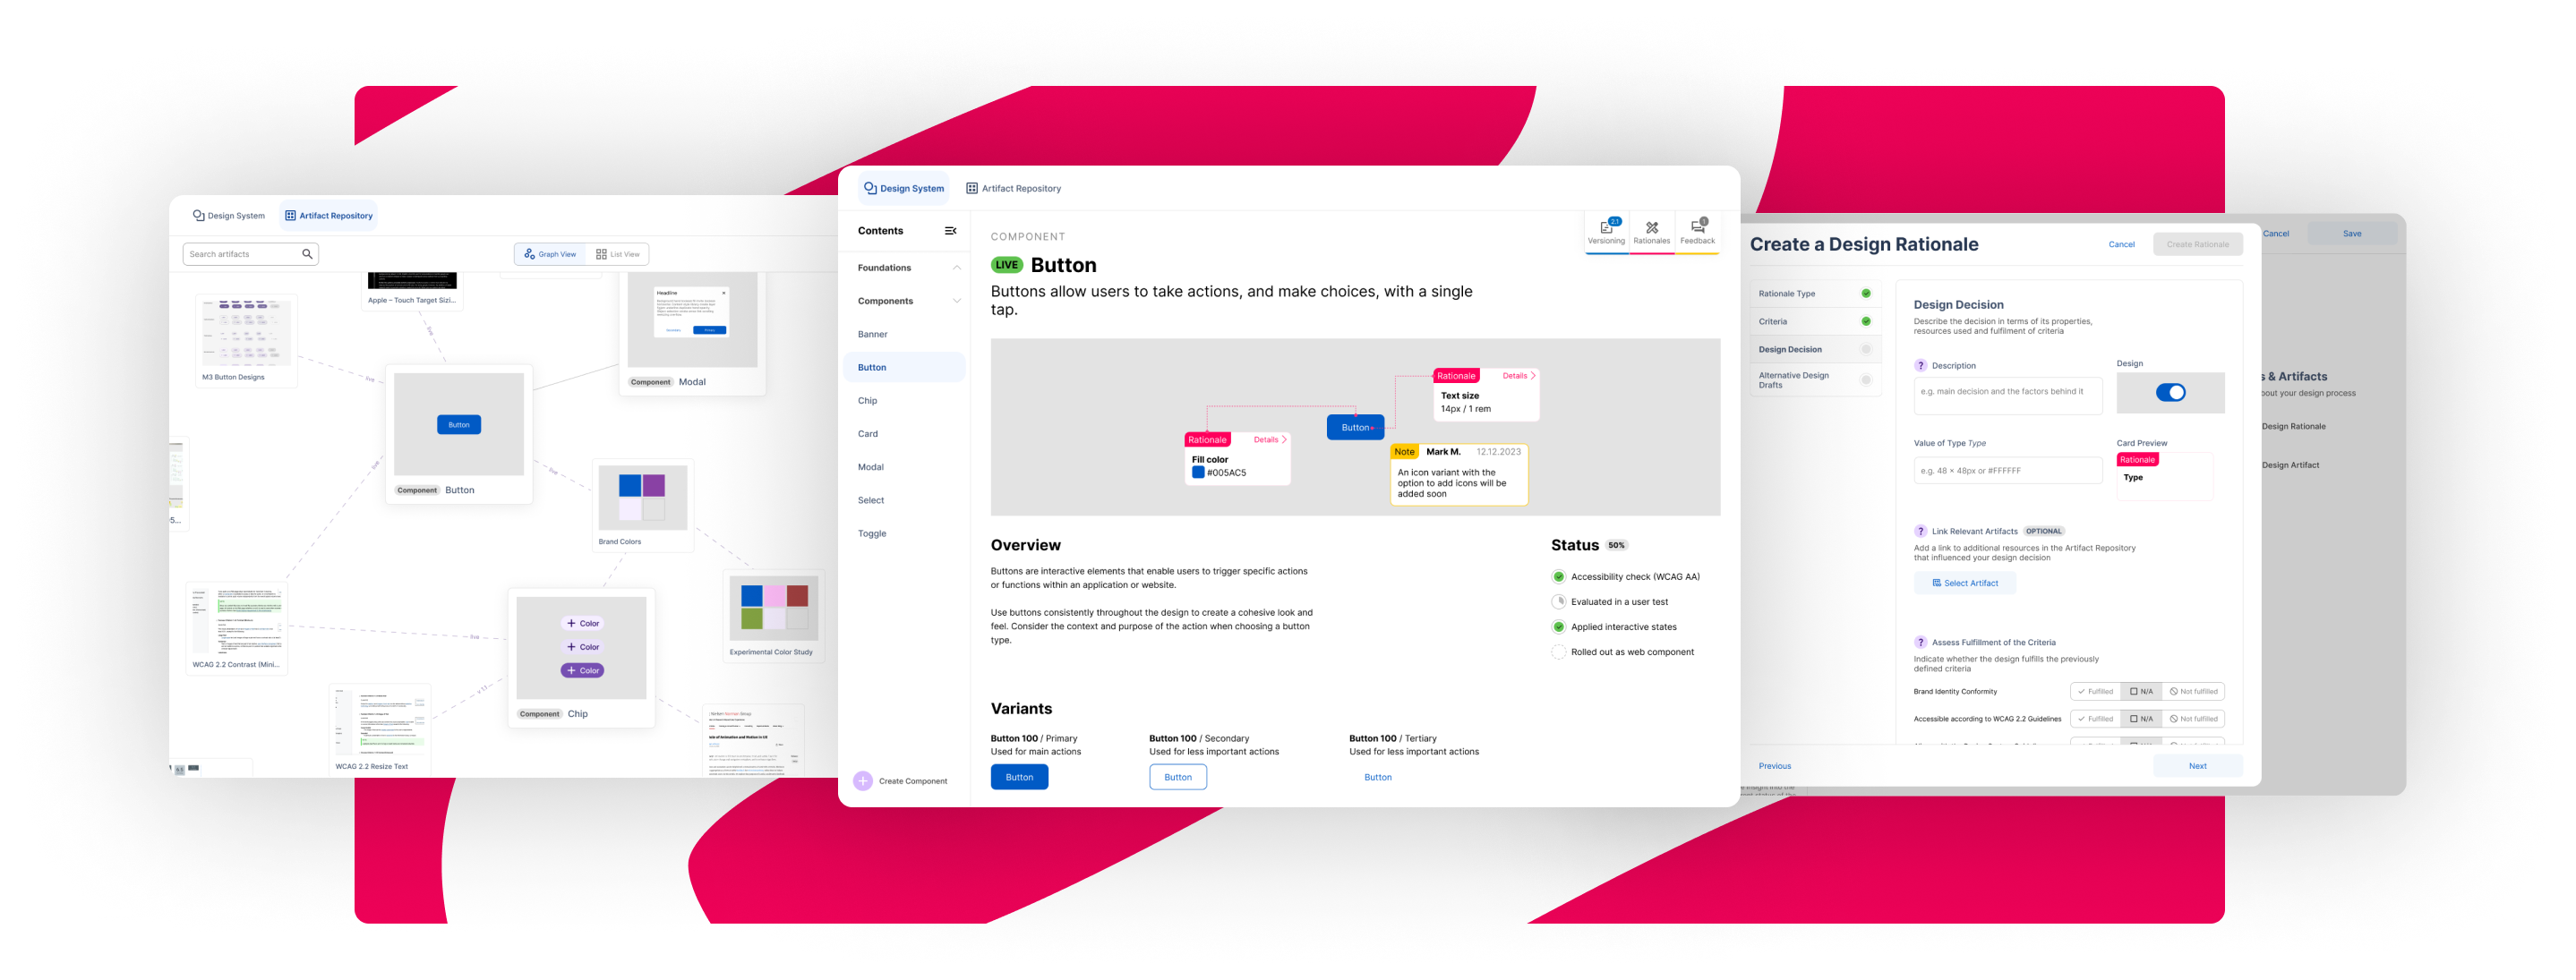
System Structure
As demonstrated by the findings of Sterman et al., 2023 and Gutierrez Lopez et al. (2018), the integration of
a space for the purpose of exploring design artifacts has been shown positive effects on the
facilitation of reflection of design processes. The structure of the developed documentation
interface follows that proposal and is divided into two subsystems.
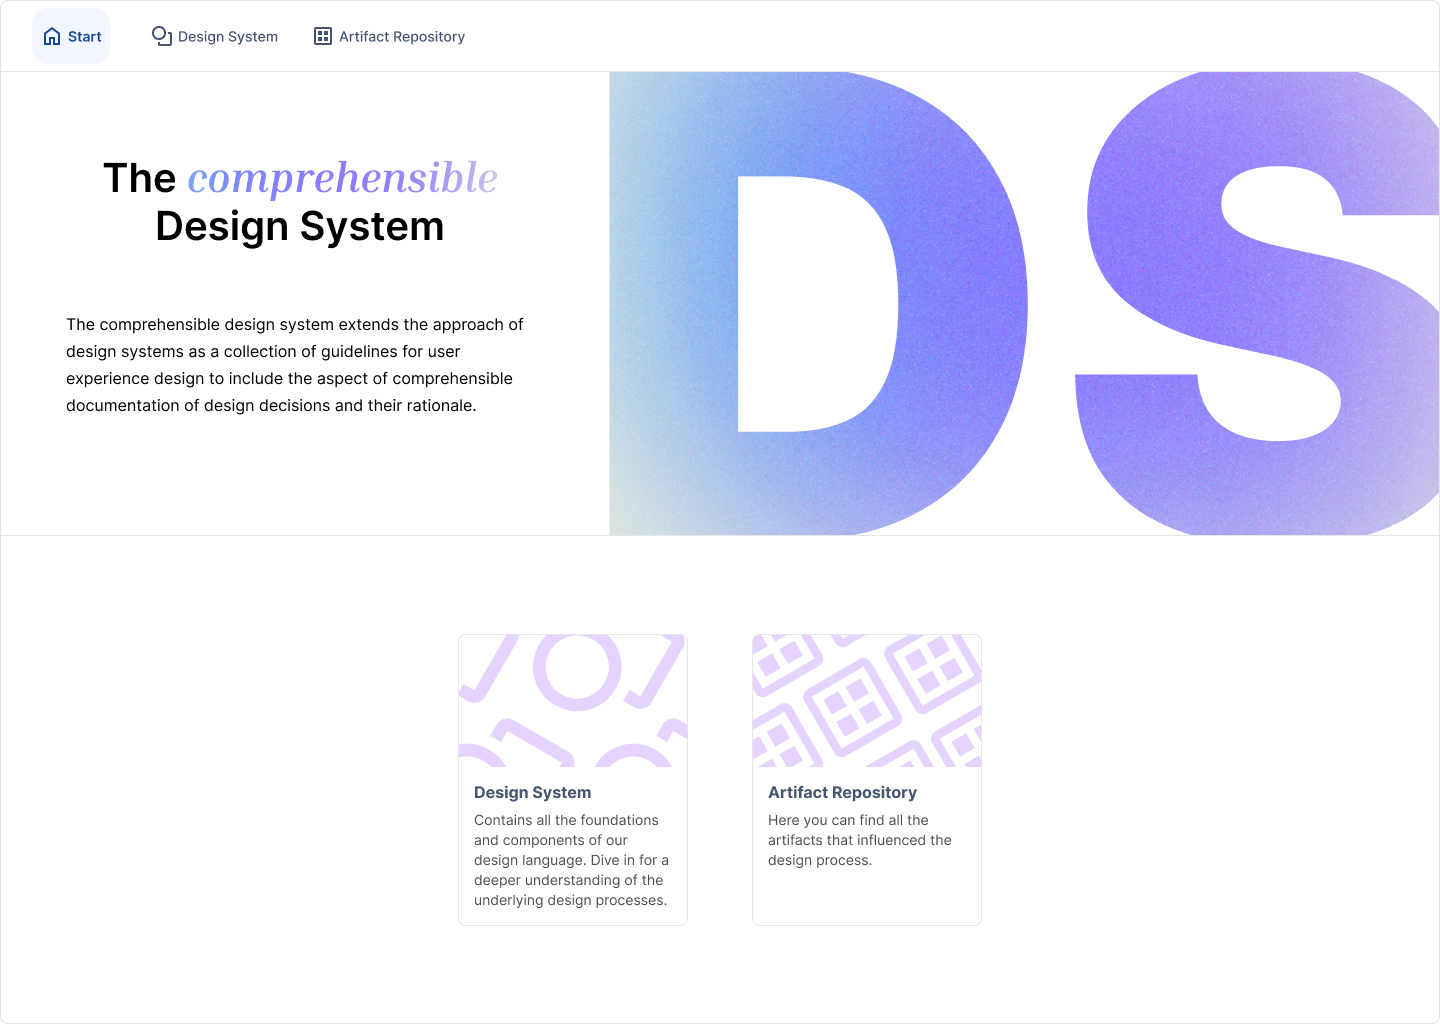
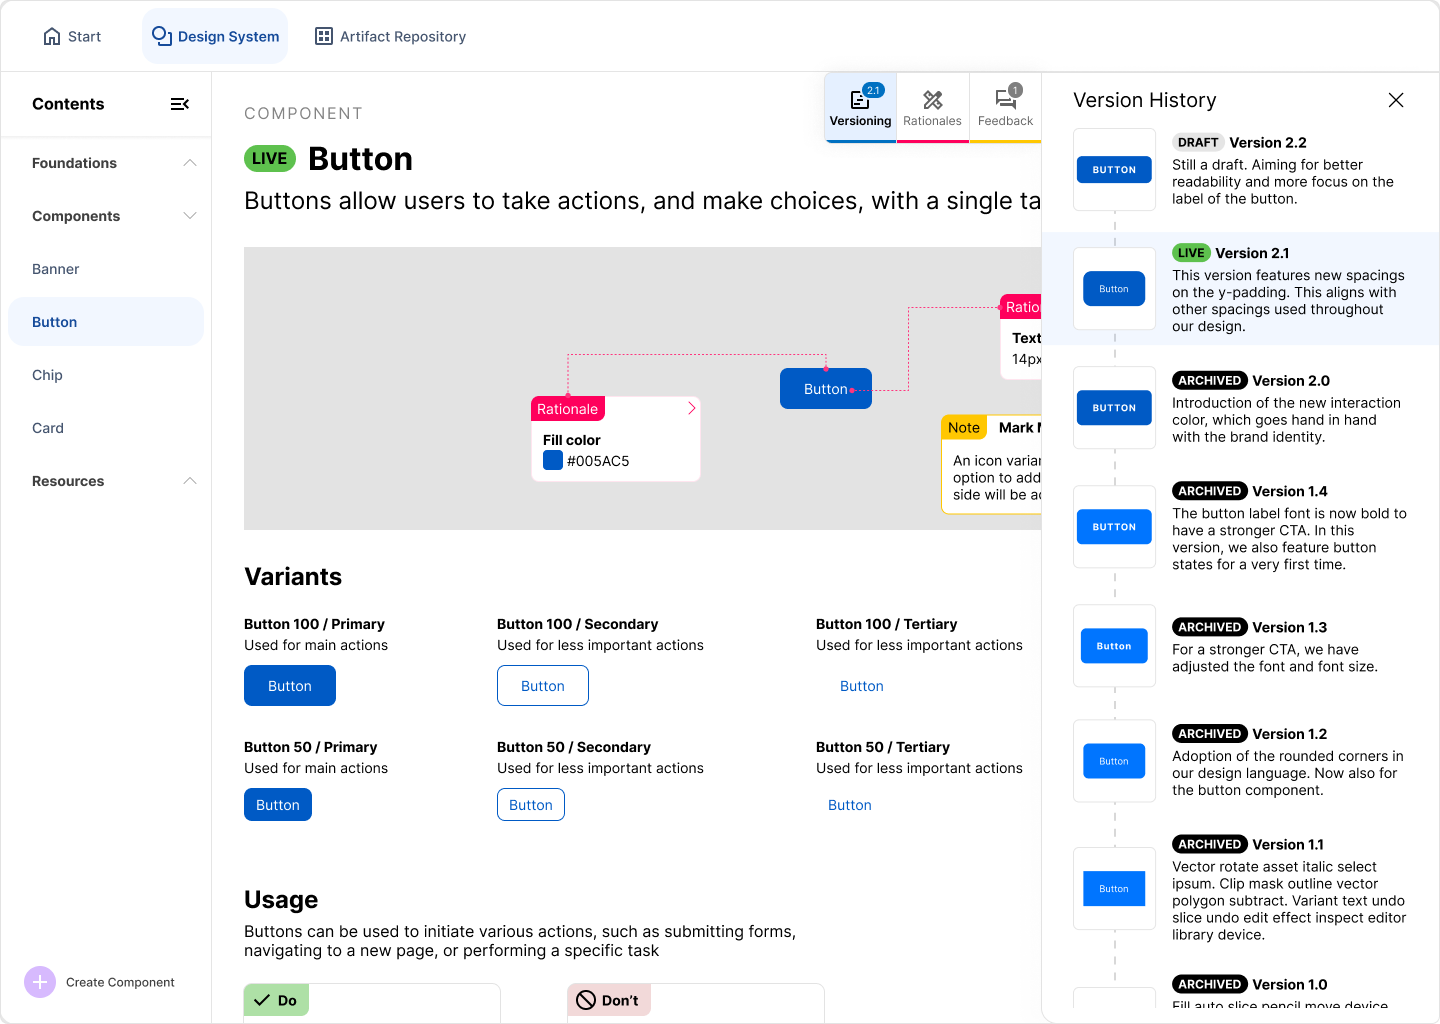
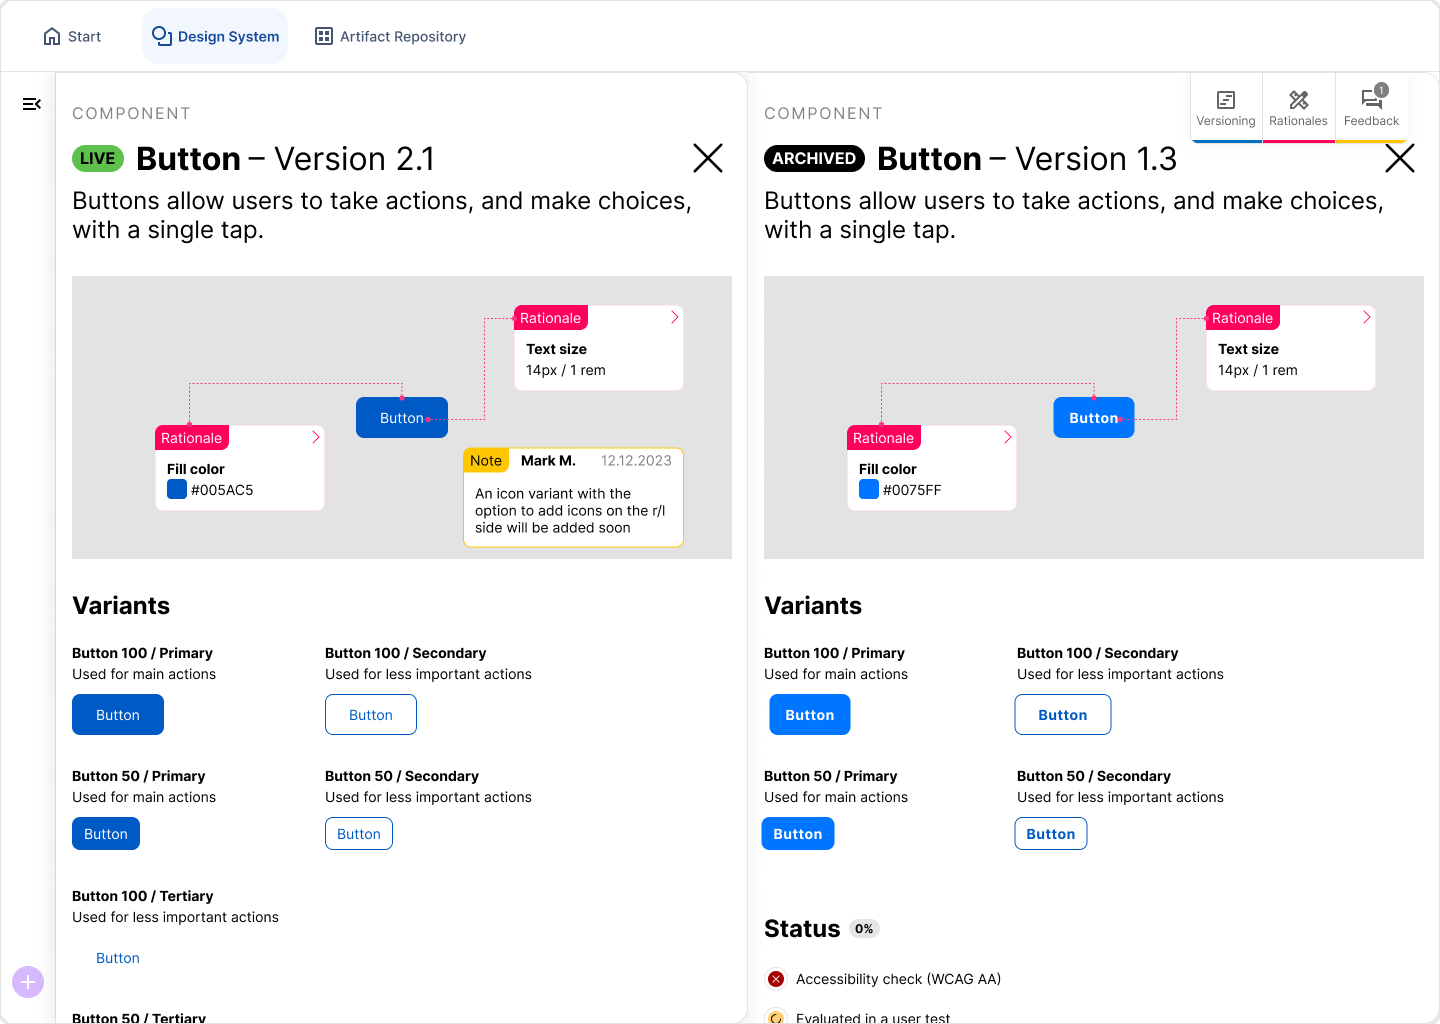
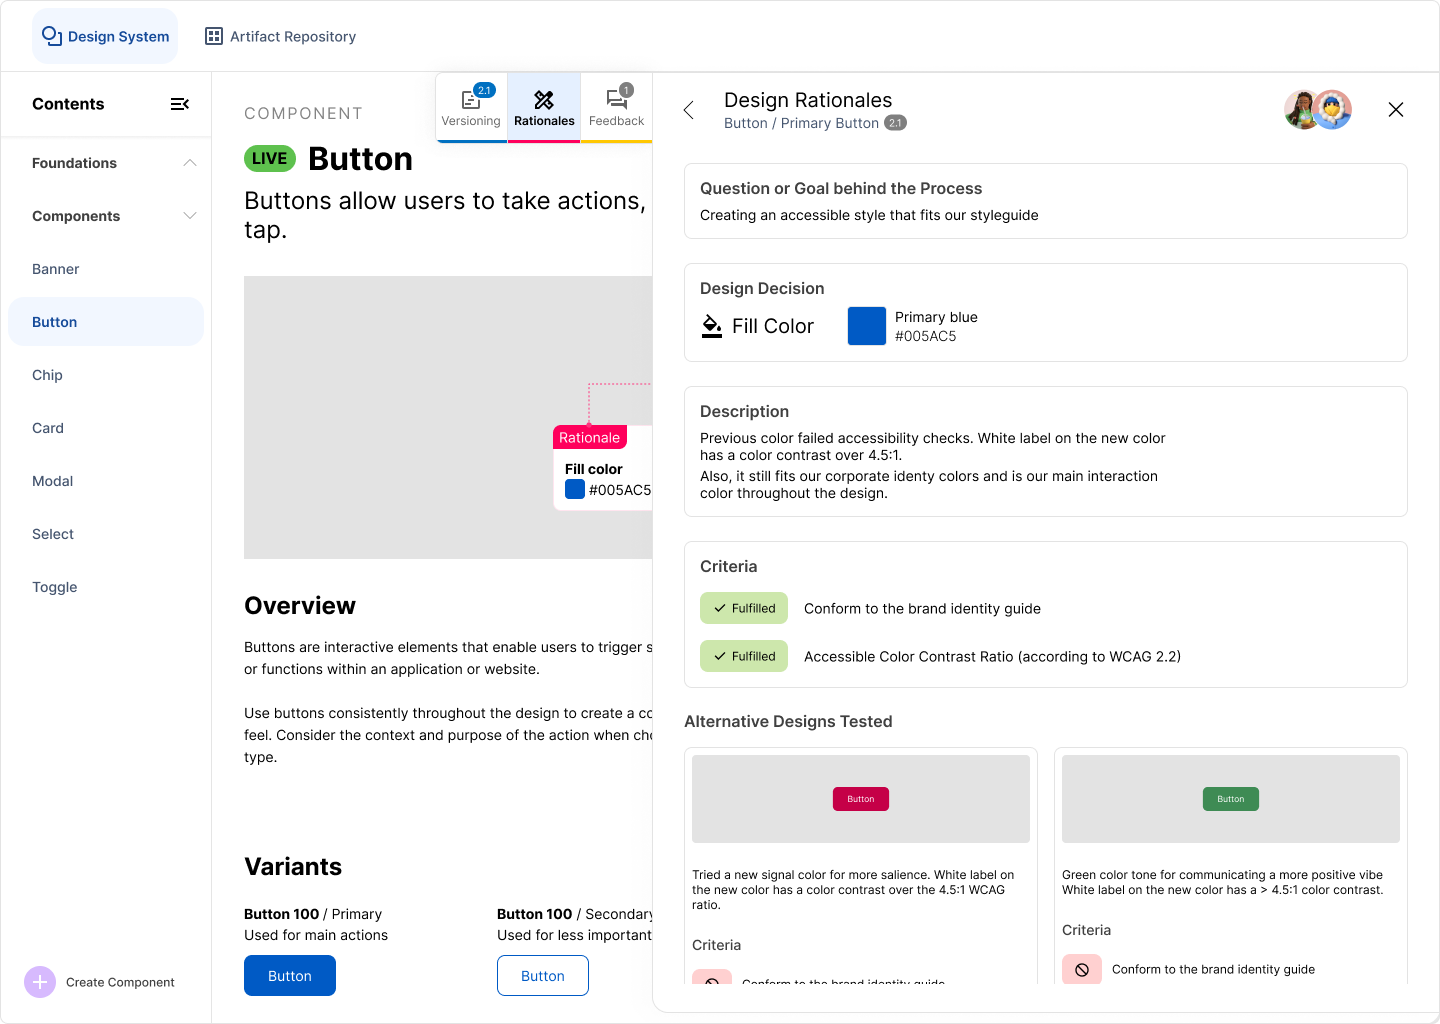
The first subsystem is the Design System. It not only covers the documentation process
itself but also the design outcome, typical design system features and the design rationale.
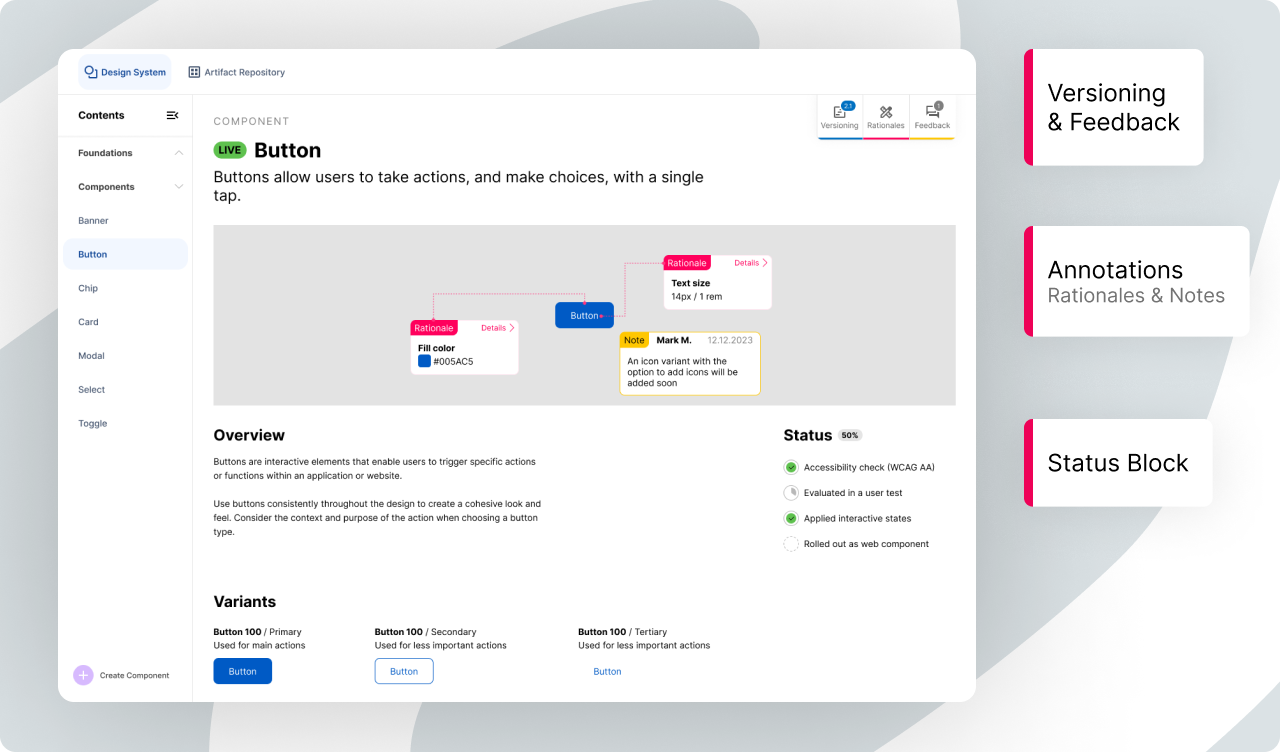
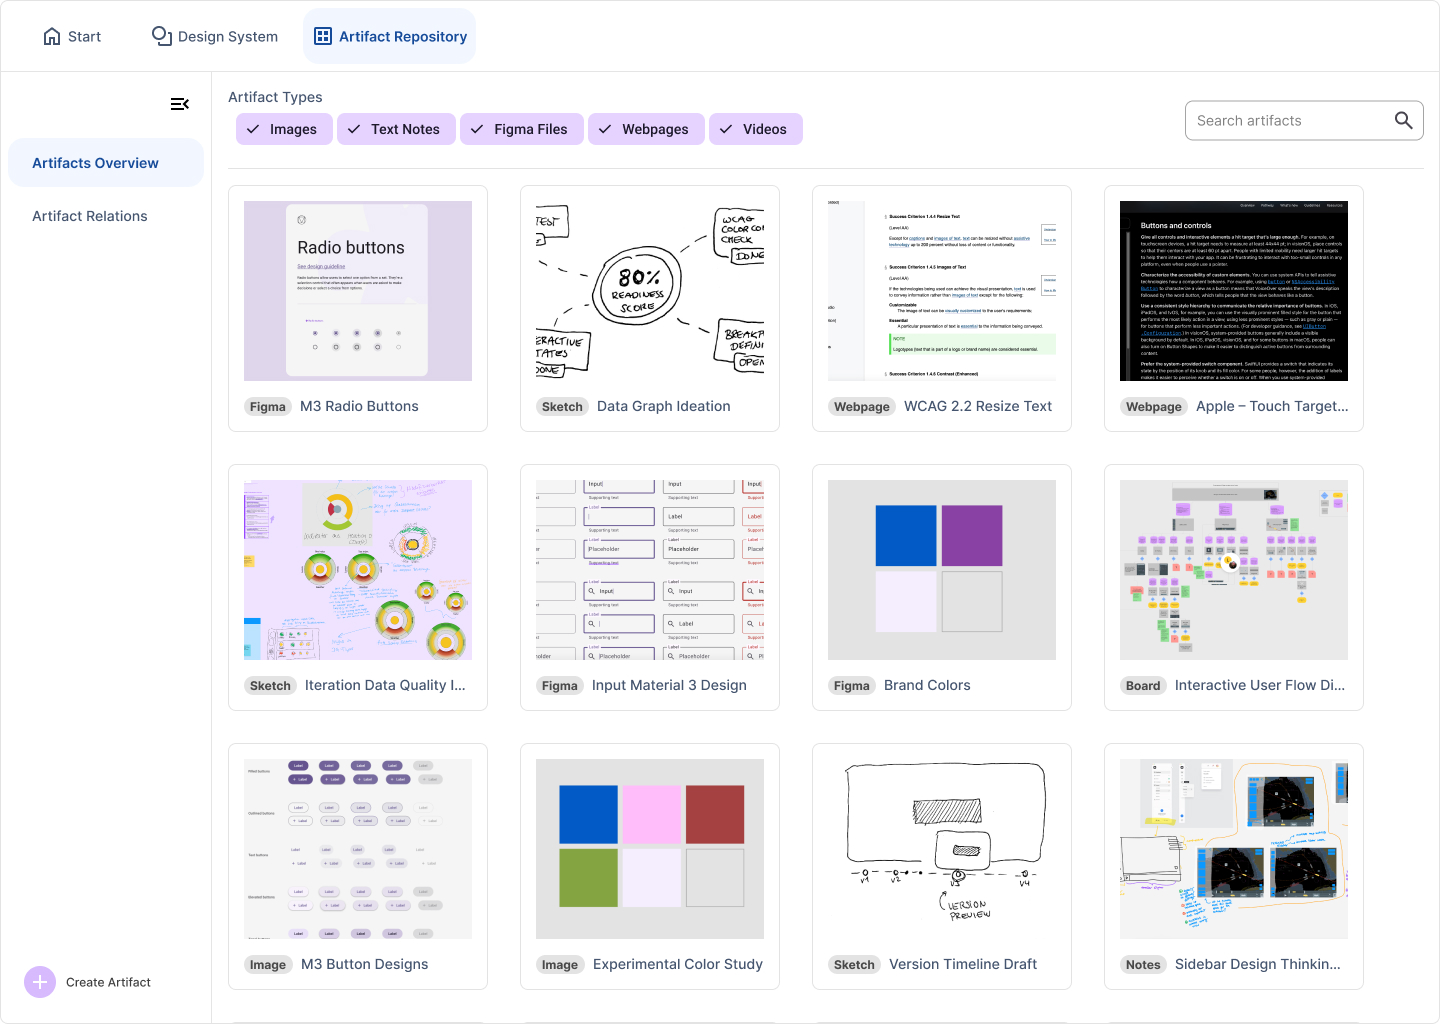
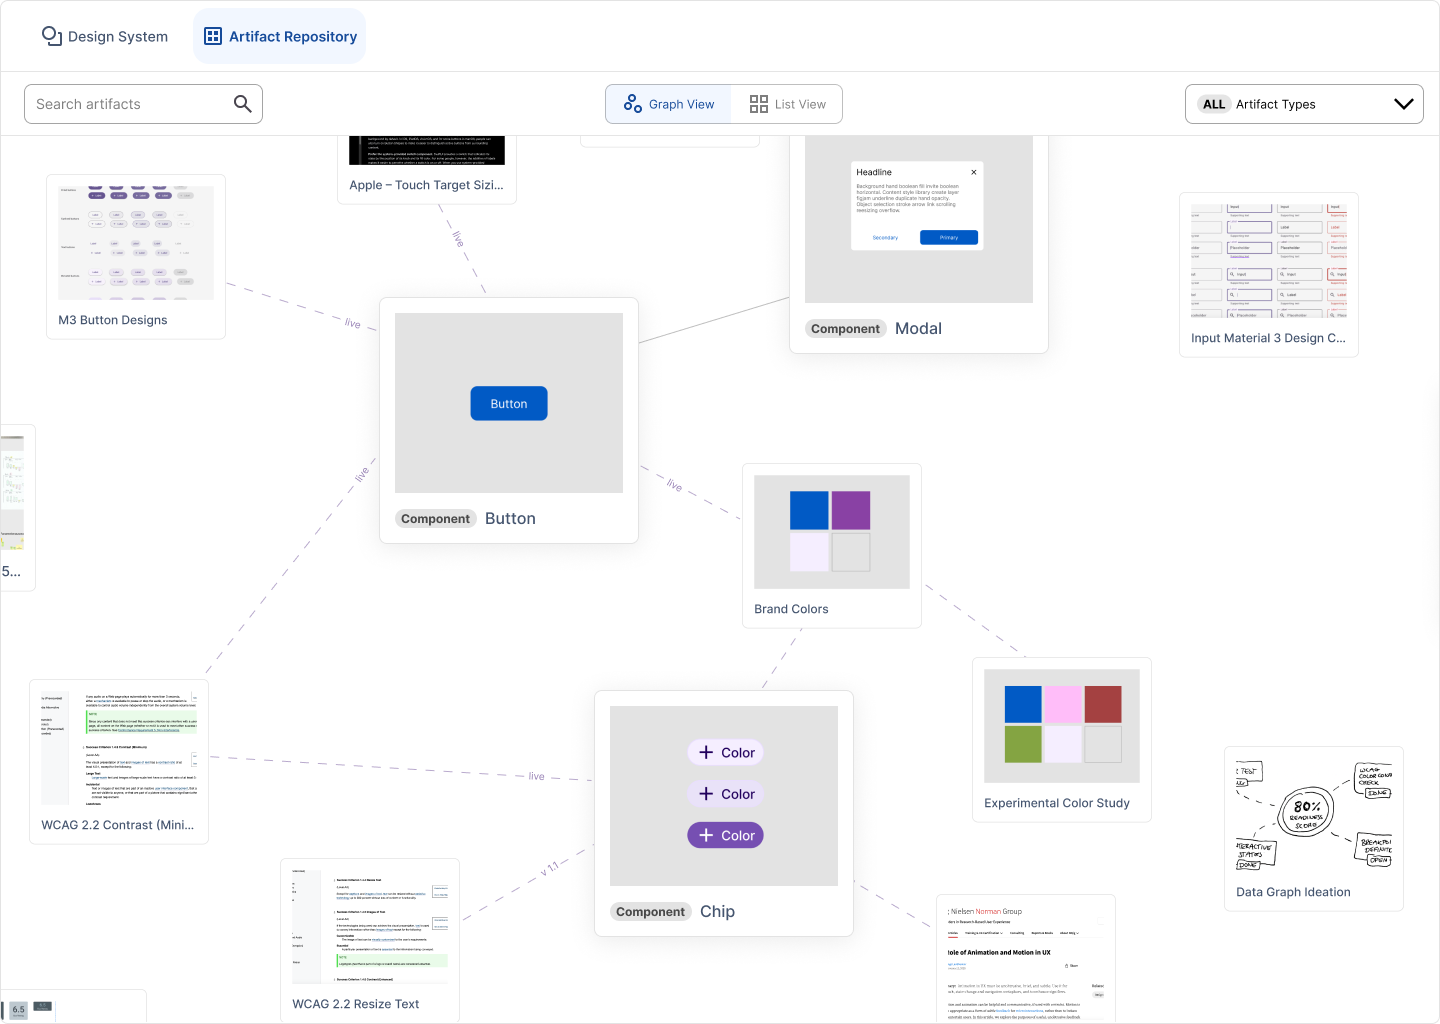
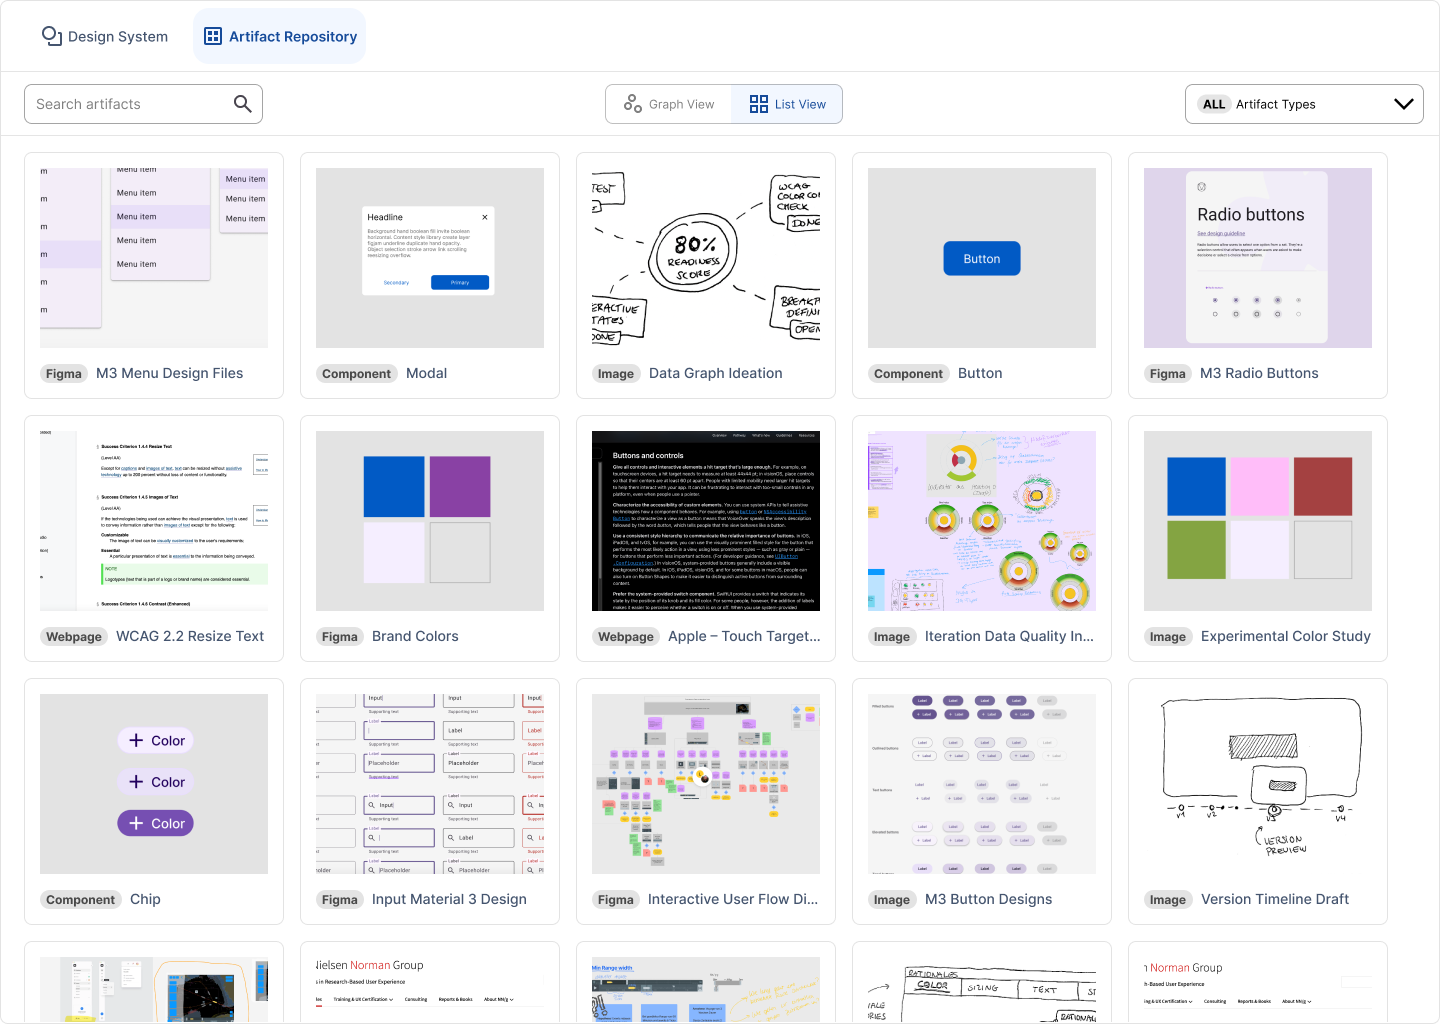
Secondly, the Artifact Repository consists of the overview page, presenting all available design artifacts. These artifacts can be examined in further detail on the individual artifact detail pages.
Views of the Traceable Design System (It. 1)
Pilot Interview Study
The design from the first generation was evaluated in a pilot study. This aimed to generate insights about the suitability of the design. Additionally, it also served as a pilot to identify and adjust the study design for the second interview study with a larger sample size.Participants & Structure
The study took place online with one participant per session.
The sessions consisted of four parts: (1) a brief introduction to the study procedure, (2) a short demography interview, (3) tasks and interaction with the prototype, and (4) a semi-structured interview.
In the third part of the study, the participants were asked to solve tasks that were intended to guide the interviewees through the functionalities
of the system and to obtain initial observations of how they navigate through the design system.
In phase 4, a semi-structured interview was conducted. For this purpose, a set of fixed questions was prepared, followed by questions that were adapted to the individual observations.
The fixed questions related to the documentation process and the perceived traceability, usability, applicability.
Results
The method to analyse the data was inspired by the affinity diagramming technique as described by Lucero (2015). The observations made during the interaction with the prototype and responses of the interviewees were collected on the whiteboard tool FigJam in the form of sticky notes. Each note was labelled with the interviewee’s identifier (e.g., A1-2 or B1-2) and color-coded with one color per participant. After each day, the notes were ordered and clustered according to the recurrence of themes.
The participants perceived guidance through the structure of the documentation process:
"(...) it was a bit like progressive disclosure, where you really only get the information that is relevant to you at the time. (...) I think that's good, that's why I perceived such guidance."
Participant B2 in the pilot interview study
Although the structural framework was provided, they felt that they had to decide a lot themselves during the documentation process, which would be only beneficial for designers who have a clear vision of the desired documentation outcome. It was indicated that more detailed guidance in what content should be filled in would have been preferred.
The participating designers felt comfortable in accessing available design rationales in the system and mention benefits in comparison to state of the art design systems:
"You can definitely find the corresponding rationales. You can definitely [trace it] better than you usually can at the moment in design systems, because that never seems to be a requirement at all."
Participant B1 in the pilot interview study
Even though the interviewees recognise the benefits of the documentation tool, they argued that the detailed documentation of design decisions is only applicable to larger design projects and teams. A2, personally, cannot imagine using it, since they rely on fast paced design output, rather than full transparency of the process.
“It would make a lot of sense to include a justification for the design decision, so as not to prevent discussions with colleagues, but at least to put a clear point behind it. And to say: 'Yes, we did it, it's reflected here'. Or that they themselves are able to recognize that (...) a lot of thought went into most of these decisions."
Participant B1 in the pilot interview study
Next to small usability issues, such as the navigational structure, almost all participants were struggling with the terms 'rationale' and 'artifact'. Thus, this had to be addressed in the second iteration.
Second Iteration
The first iteration has already led to initial insights into how design rationale can be integrated into the structure of a design system in order to increase the traceability of design decisions. The second iteration will build on these findings in order to refine the concept with regard to these objectives.
Design Changes
The pilot interview study with experts from the user experience design field generated preliminary insights into the usability of the interface regarding the task of documenting and tracing design decisions. Based on these findings, design adjustments were made to the concept, which are described in the following sections.
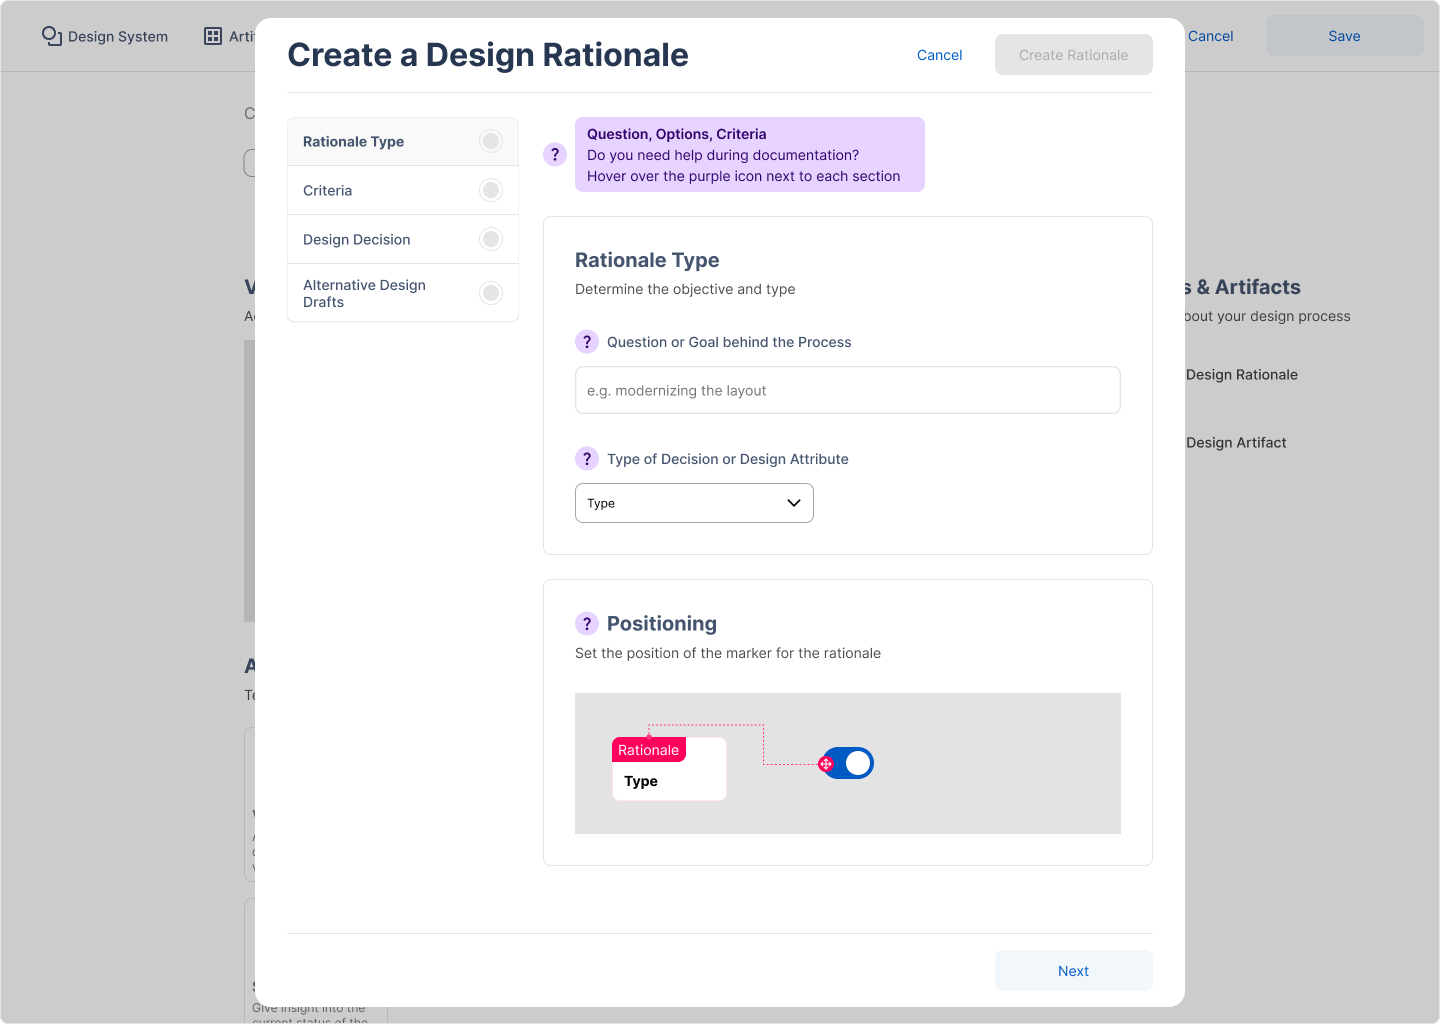
Rationale Capturing Process
Although the system offered guidance through the automatic step-by-step opening and closing of documentation steps, the participants seemed overwhelmed by the structure. This is partly due to the fact that it was not clear to them why blocks were suddenly minimized, and partly because the prototype had bugs with regard to this function. The functionality of the process dialog has therefore been completely redesigned to provide a step-by-step process, adopting the format of a wizard dialog. Wizards can be used to route through complex processes, while reducing the cognitive effort needed to complete it (Budiu, 2017).
Miscellaneous
It was observed that the implementation hardly allows the influence that the individual artifacts have on decisions or other artifacts to be understood. Both in the design rationales and on the artifact detail pages, the artifact card was modified so that it now allows free text for the description of the impact on the design. Additionally, avatars of the designers who worked on the artifact have been added to provide information about those responsible and to allow for follow-up questions.
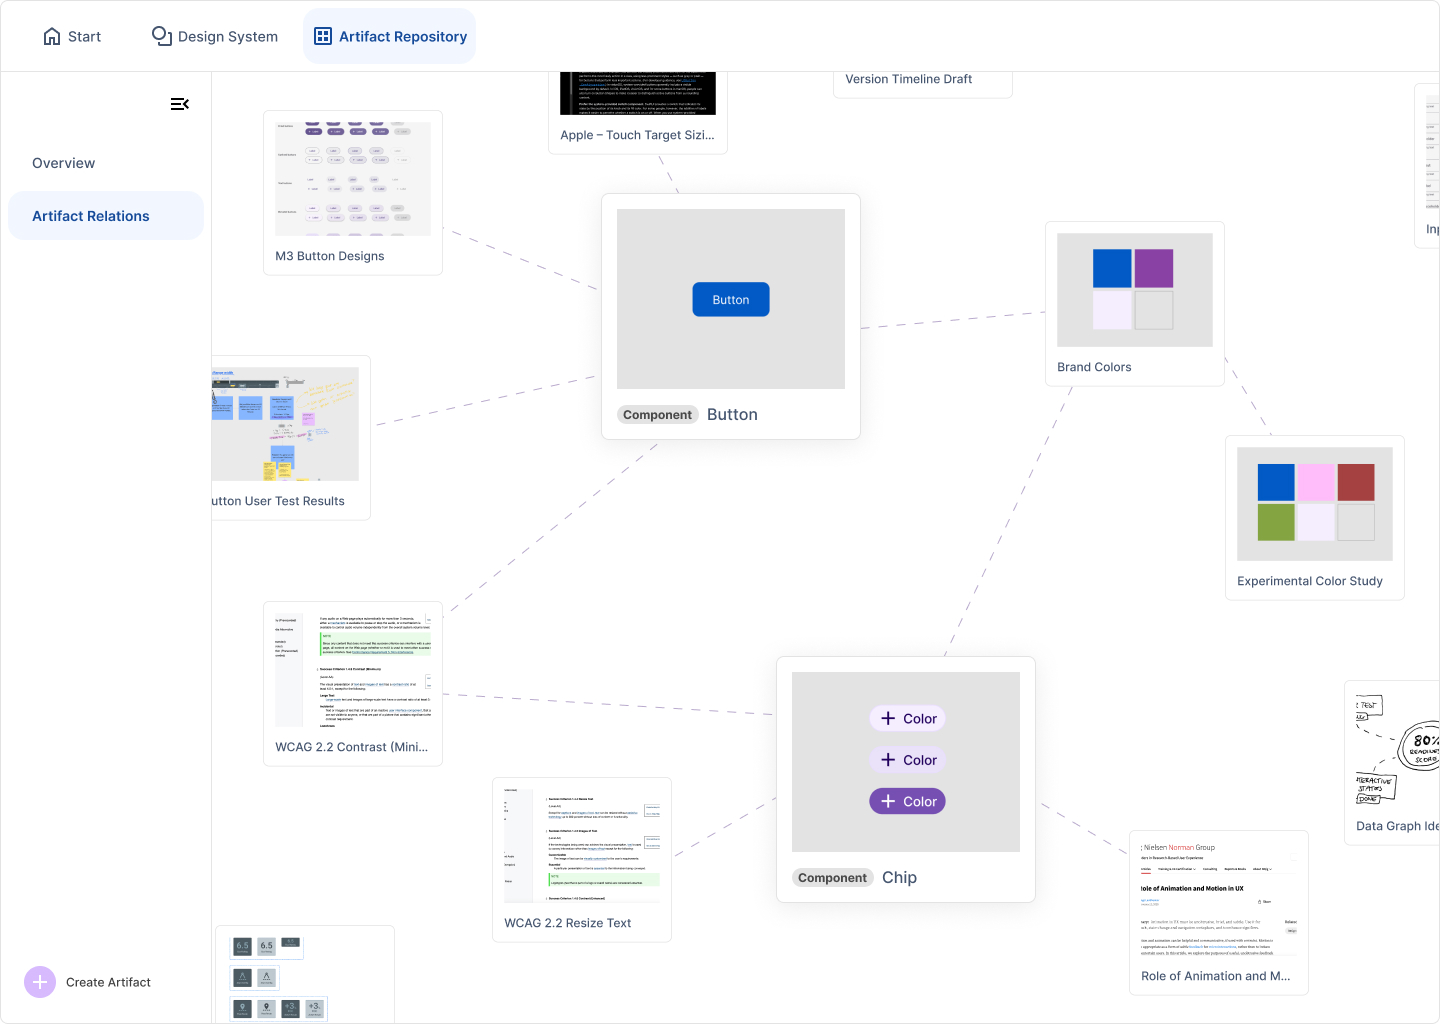
The Artifact Repository consists of two views, each designed to address distinct tasks. The graph view allows for the inspection of artifact relations and clusters, while the list serves as a quick overview of all artifacts and allows for in-depth filtering. However, designers mostly interacted with the list view and overlooked the tab for the graph view in the sidebar, as it was the default page when accessing the Artifact Repository. To make the option of using two different view modes more salient, they were merged onto the same page. For that, the switch to toggle between the two view modes was moved to the top bar, where the filtering options are located, too.
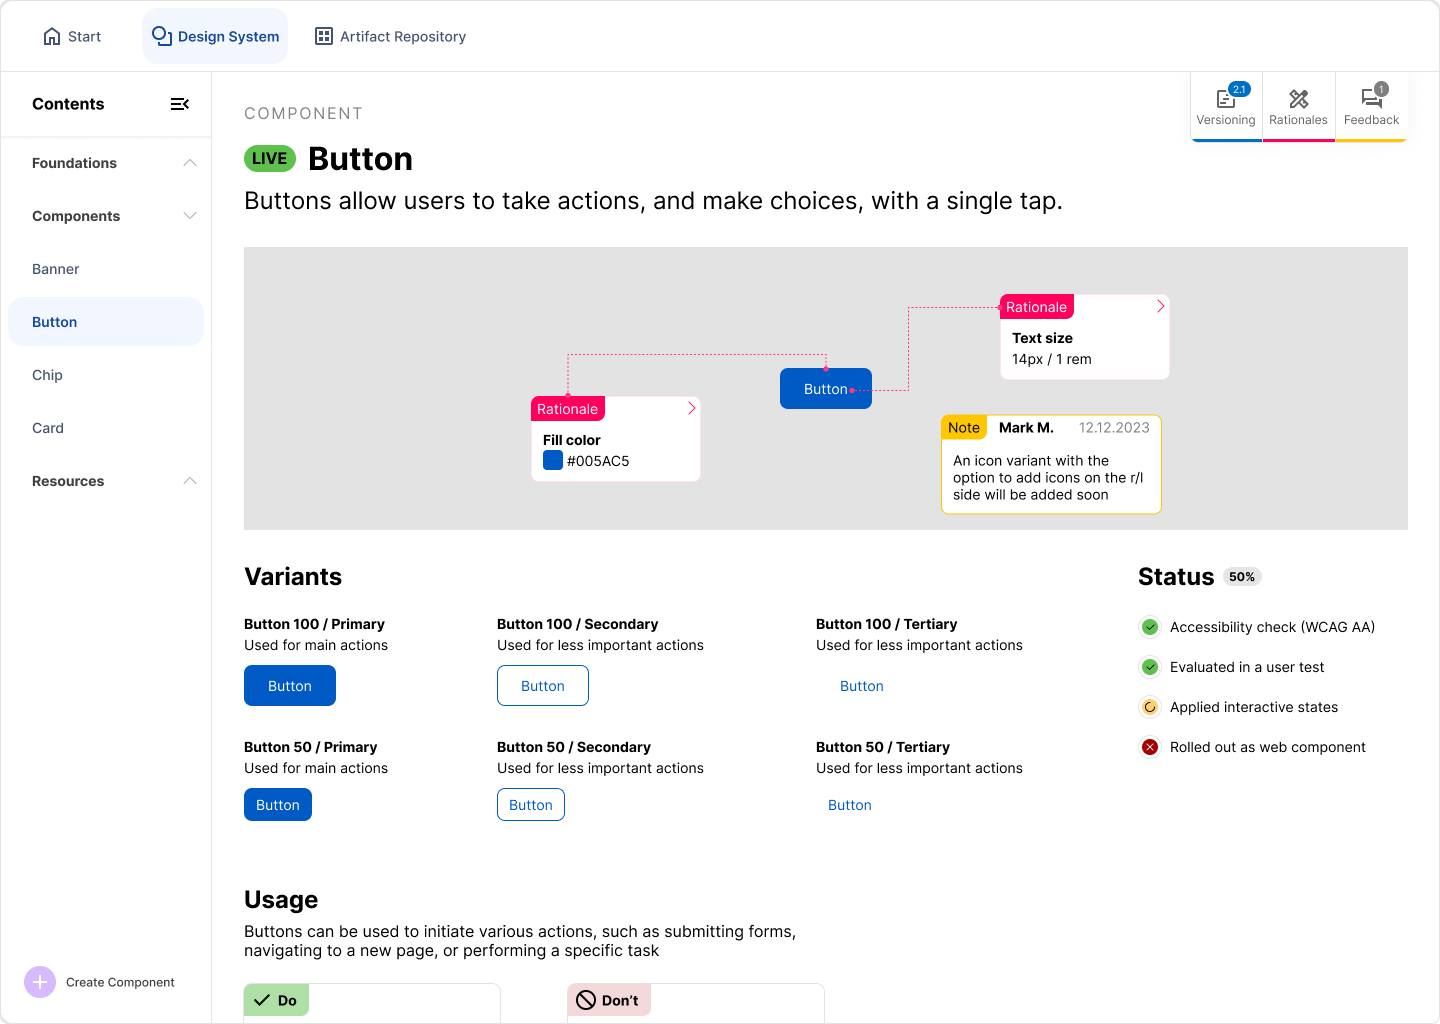
Adjusted Views after Iteration 2
Interview Study
Participants & Structure
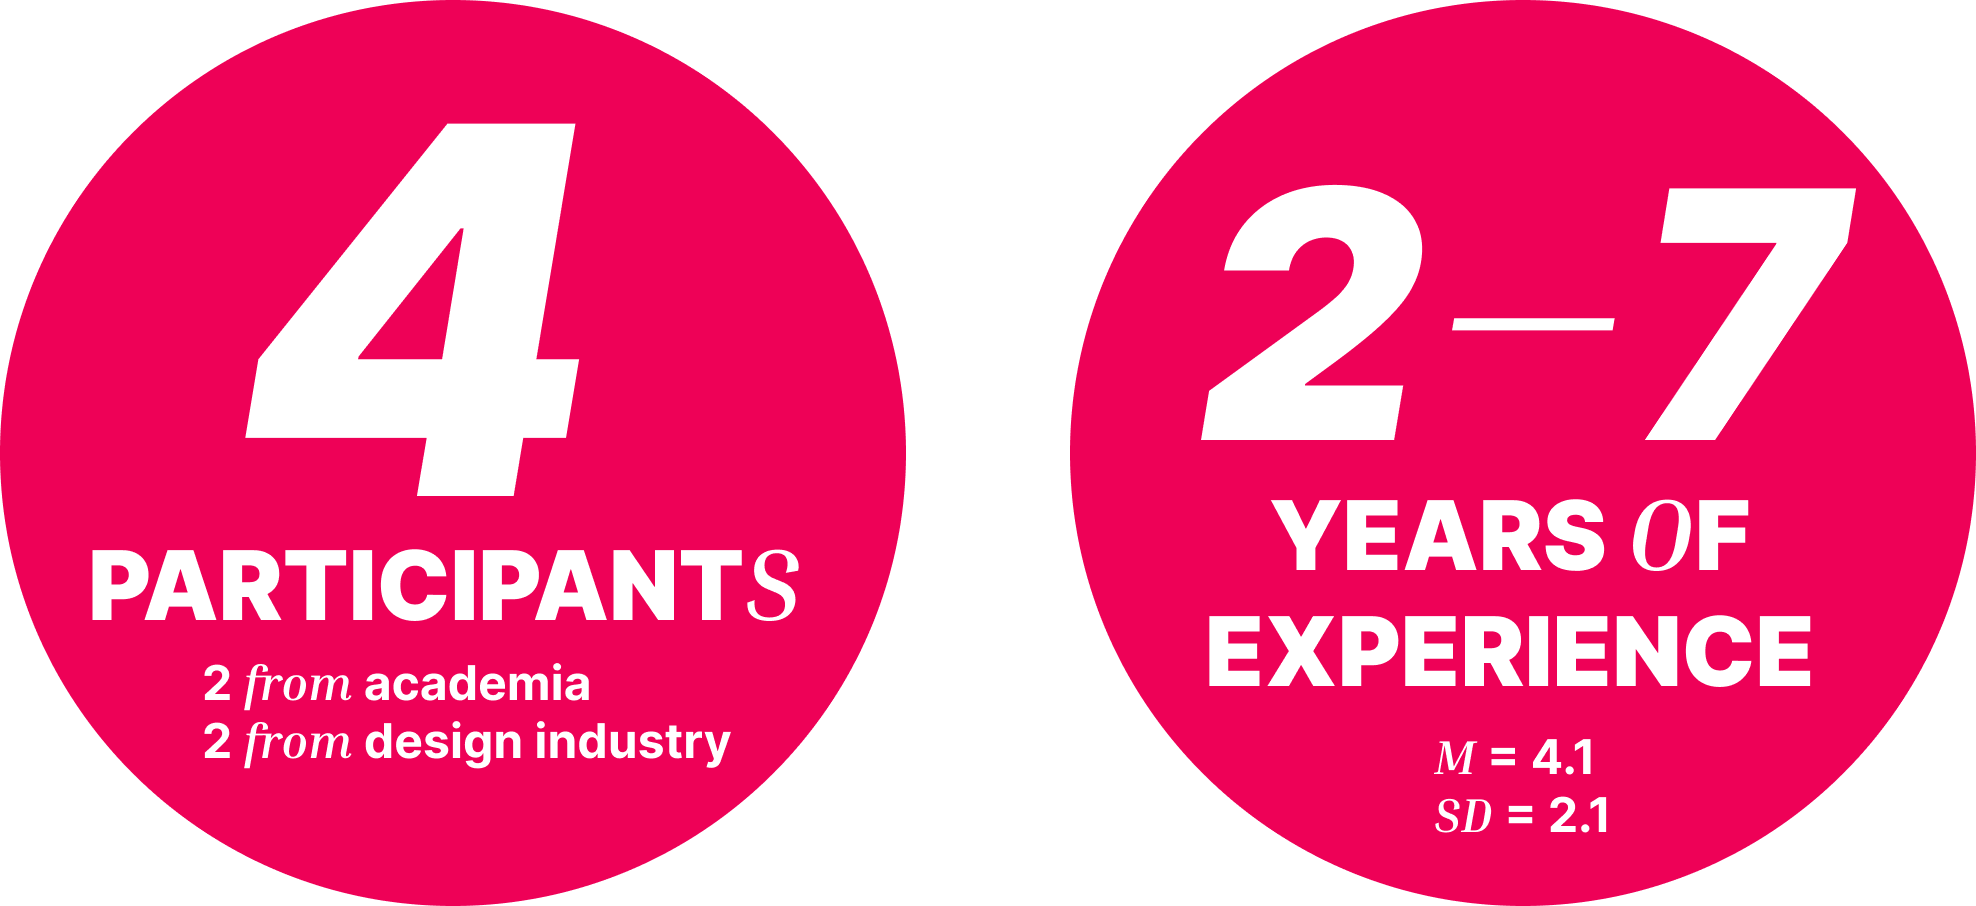
For the final interview study, designers from the academic and industrial context were invited to interact with the prototype of the design system.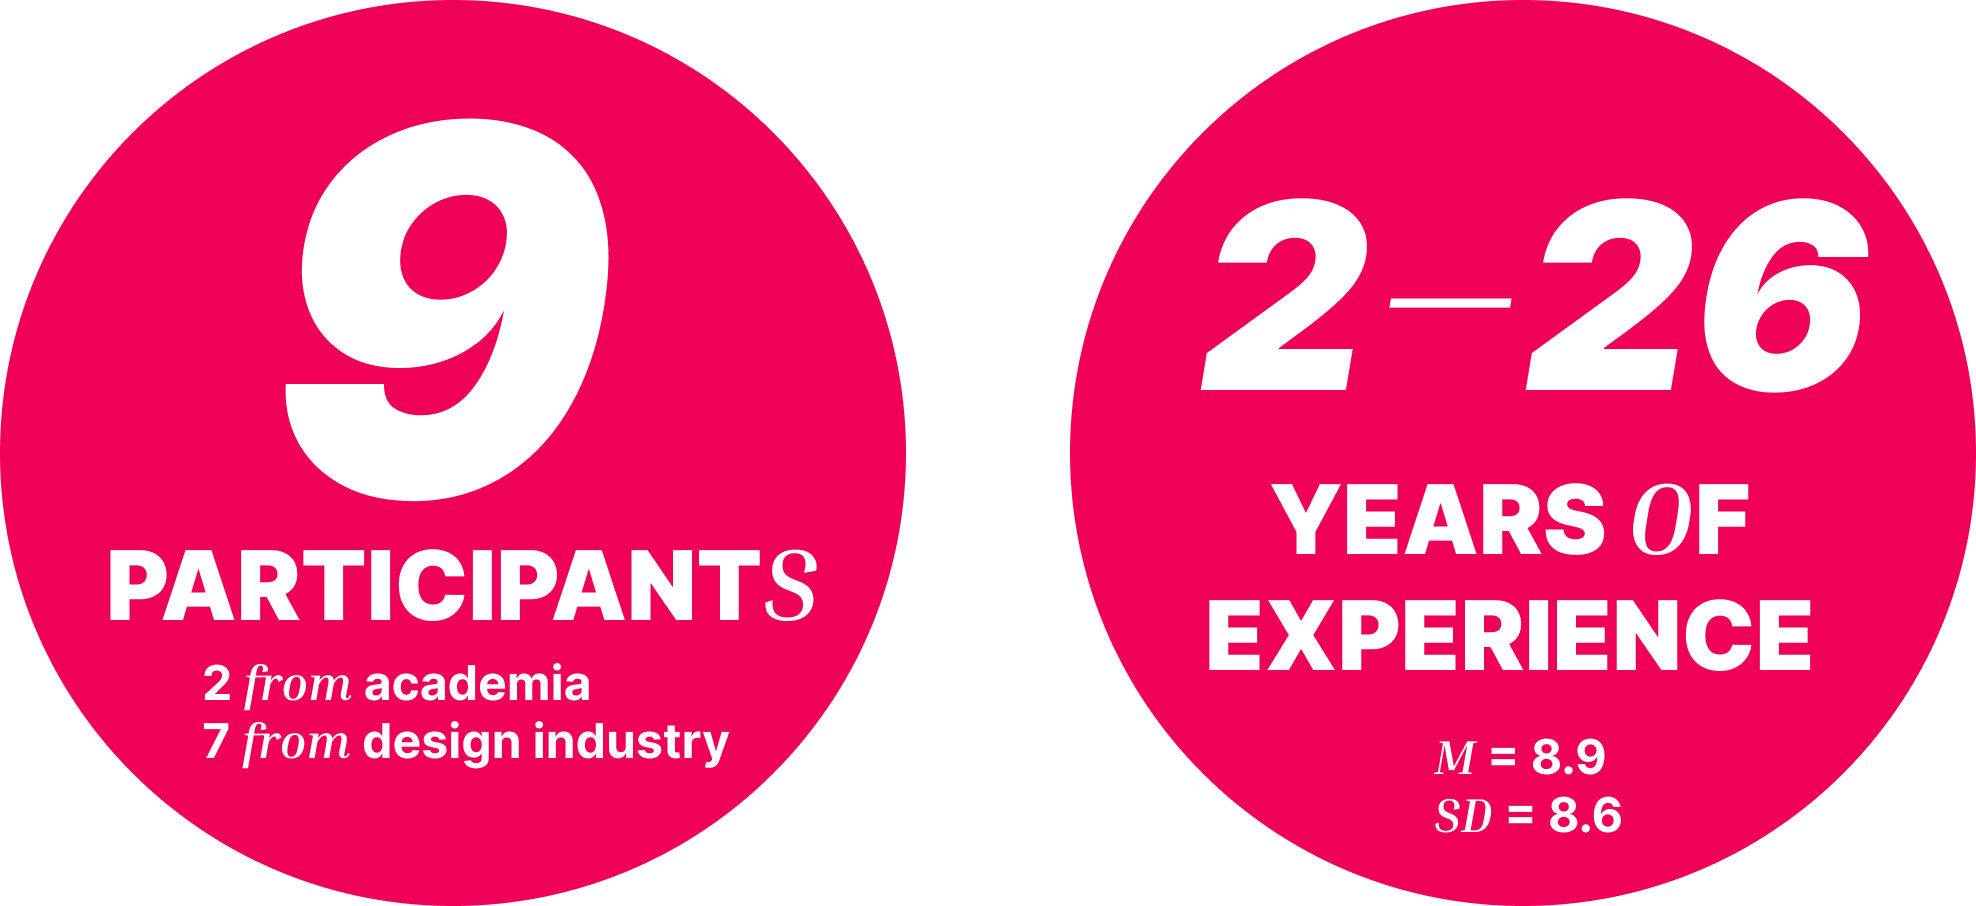
The structure follows that of the initial pilot interview study, with the addition of the processing of the User Experience Questionnaire (short version).
Furthermore, detailed scenarios were added to the tasks to enable participants to gain a deeper understanding of the context.
Results
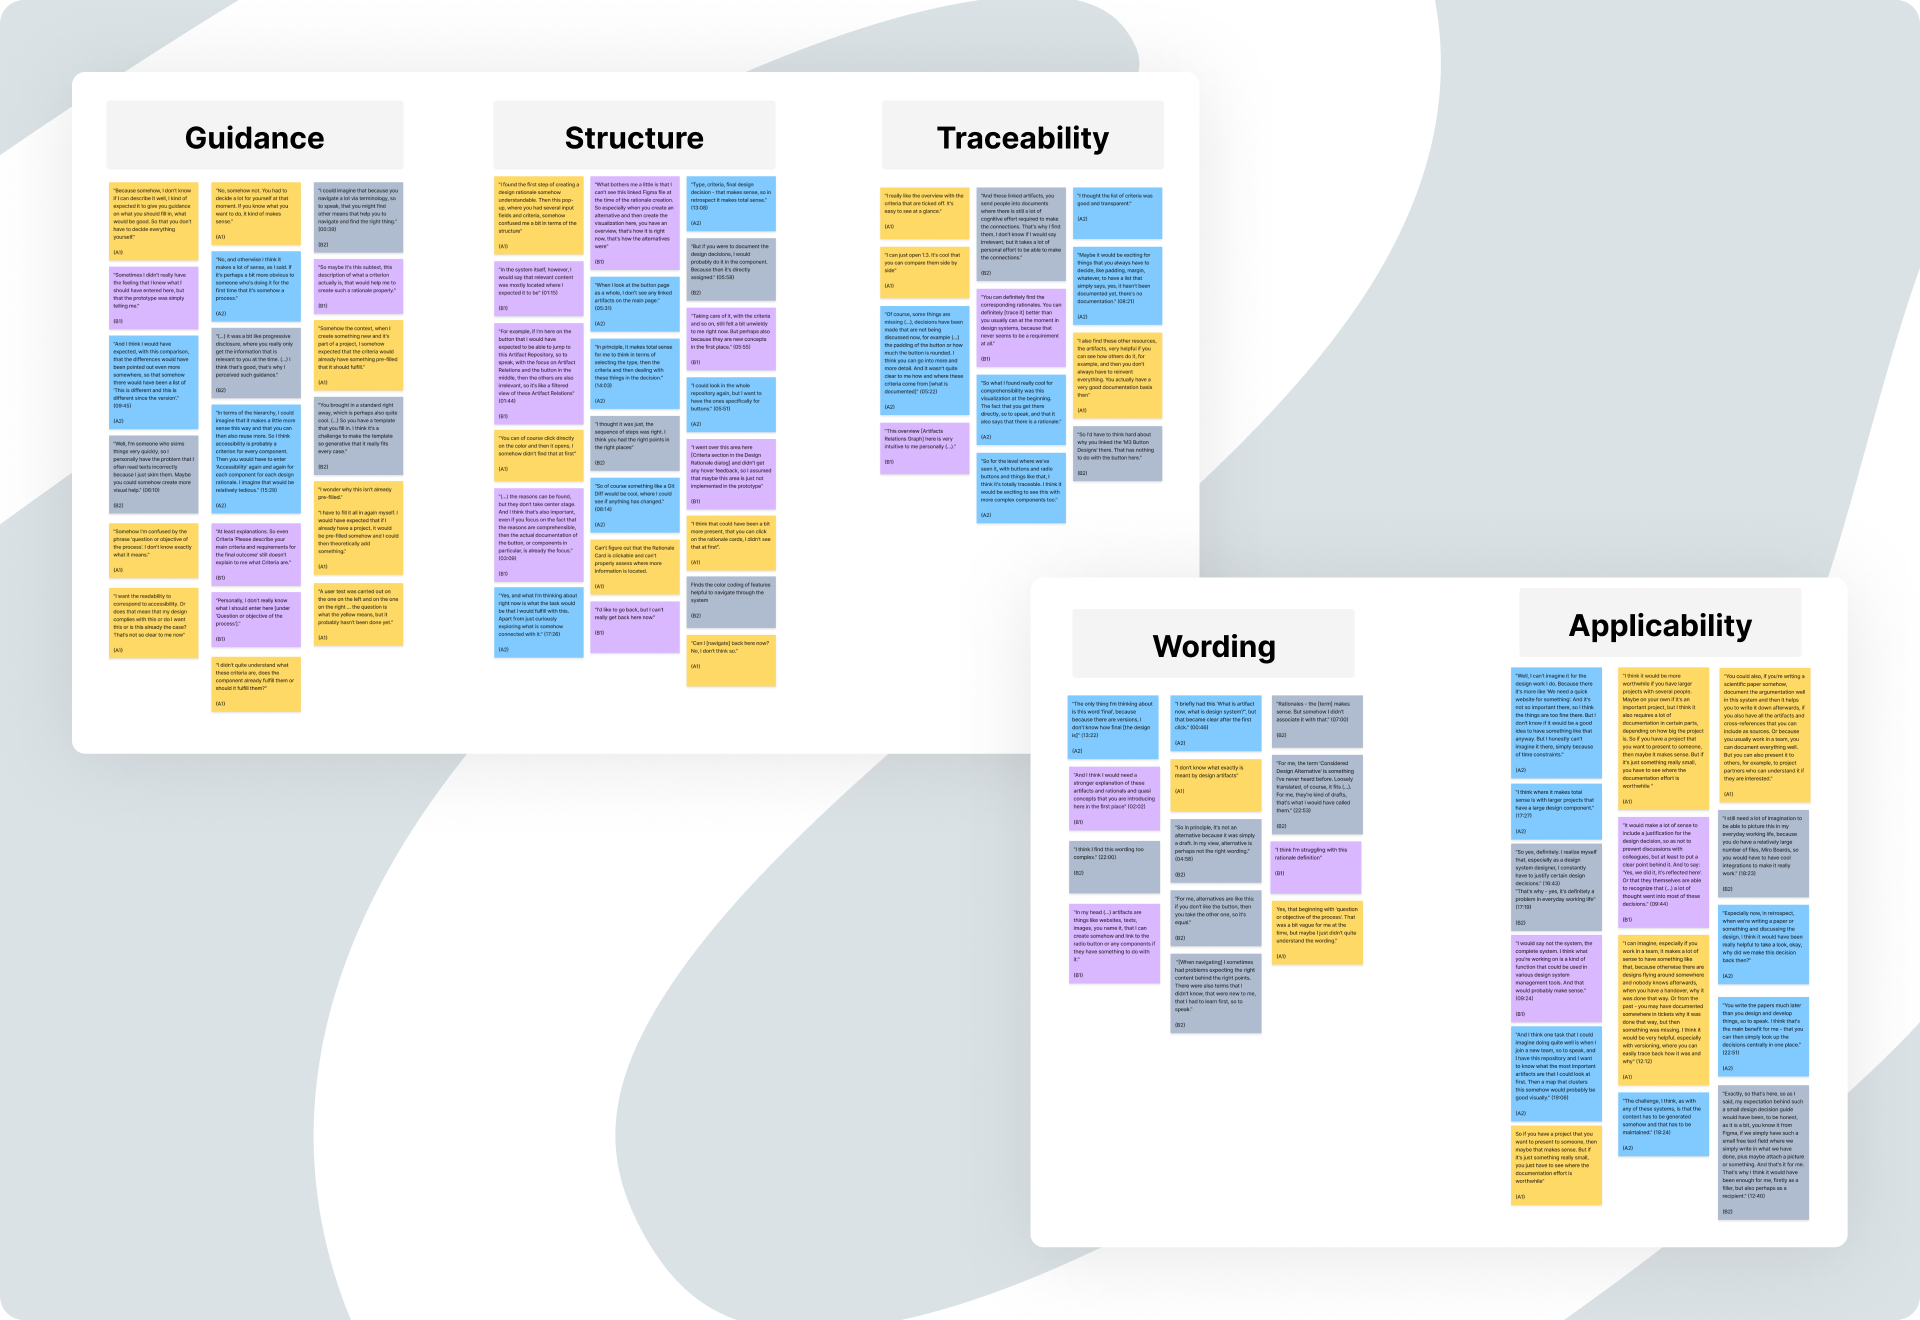
For the data analysis, the same procedure as in the pilot interview study was used, utilizing the affinity diagramming method.
The tightly defined structure limits the flexibility to incorporate individual capturing practices. However, participants stated that design decisions are far more complex than what can be covered by the proposed interface.
"The documents I can link make sense, but I think I need more space to say 'I decided this because...' and who decided it? They had that opinion and they had this opinion and we agreed on it."
Participant I6 in the final interview study
A designer stated that a certain degree of effort might be needed when initially creating the design system with additional design rationales. However, they thought that the guided process provides a supportive basis for this task to reduce the effort required. I3 pointed out that design systems are usually a side-project, managed by a small team and thus the required effort to document rationales cannot be invested. Similarly, R2 raised the question, to which level of detail the documentation is consuming more time compared to what it would save in the long term. Nevertheless, the interviewees also reported that available documentation is not always actively used in the daily work life, further reducing the value of documentation. I4 claimed to have created detailed design documentation before, but experienced that other design colleagues still did not want to read it. If this leads to documentation scarcely being updated, it could cause a vicious cycle:
"I'm telling you, the case is 90% of users no longer go to the documentation page, they just stay in Figma. And it can happen that such things become outdated. And outdated content is always the beginning of the end of the design system. So I think it's nice to have something like this, but I think it places demands on design system teams that probably not many can fulfill.”
Participant I3 in the final interview study
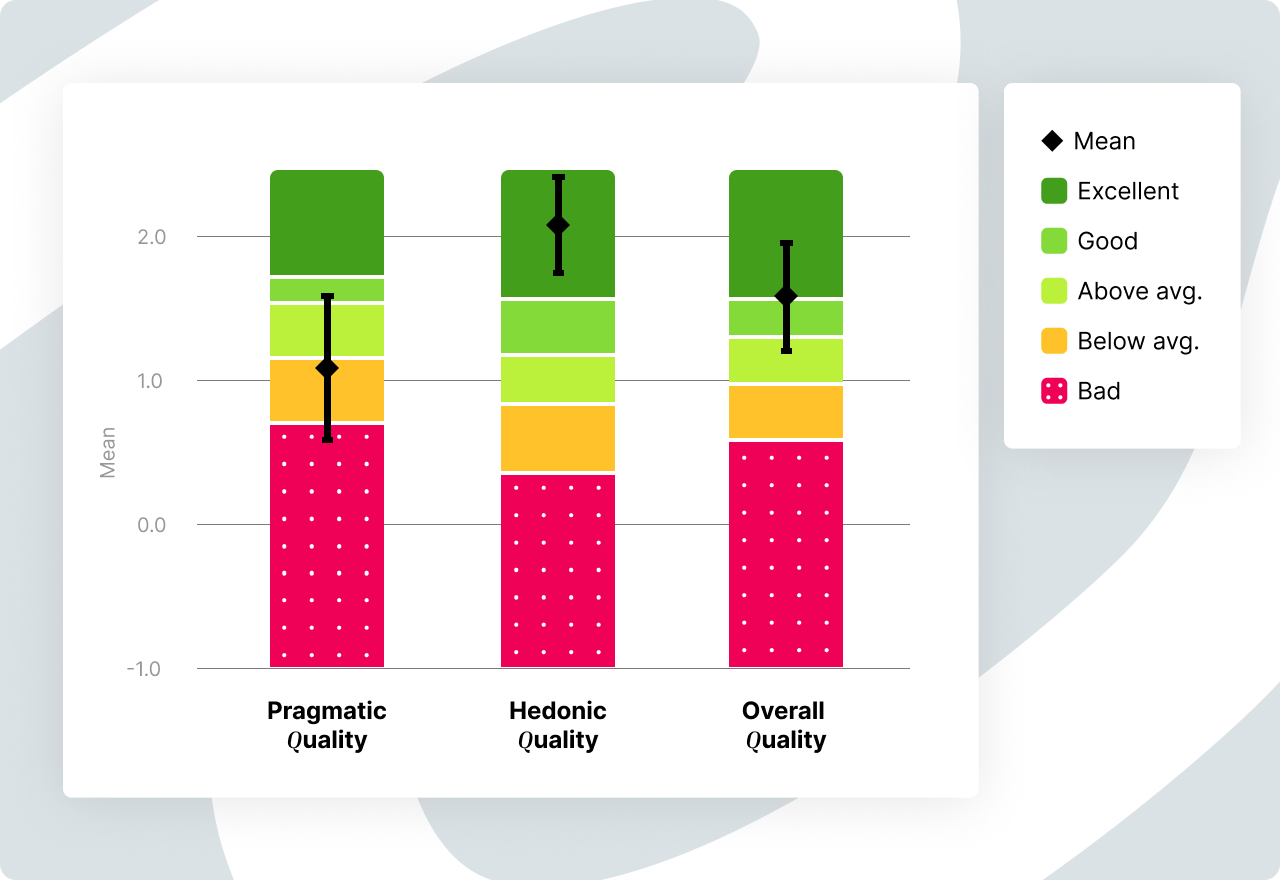
Additionally to the qualitative interview, the interviewees were asked to fill out the short version of the User Experience Questionnaire. The pragmatic quality scale scores on average one point lower than the hedonic quality scale. Nevertheless, the scales show a positive trend both individually and overall.
Key Insights & Discussion
The findings of the study and the extent of perceived traceability and guidance in the rationale documentation process can be summarized as follows:
The interface was perceived as a centralized knowledge repository that stores design
rationales and is accessible for all parties involved in design. Rasmussen et al. (2020)
have found that designers are frustrated by having to search for relevant information from
a variety of tools, as there are no standardized tools for the purpose of design documentation.
As the participants stated that they work with design systems anyway, the concept
of extending design systems is therefore not an additional tool that might cause further
frustration, but rather combines different tools.
With regard to the degree of guidance provided by the process, it can be summarized that the participants perceived guidance
in the rationale documentation process, in particular through the predefined structure
of the template and the interactive process. Additionally, the participants believed that they would be able to navigate
the system more flawlessly after a short period of using the system through the structured
process. In combination with the on average positive quantitative results and qualitative
comments, it can be assumed that the designers acknowledged the novelty of the concept
as one of the reasons for the initial comprehension issues.
The most controversial topic was the applicability of the concept in terms of the cost-benefit
ratio in the context of everyday design work. One of the key concerns was the
effort needed to document design rationales, as some decisions can be defined in arbitrarily
small steps, which may reduce the level of productivity rather than saving time in the long
term. This observation cannot be validated by the results of the UEQ-S, as the evaluation
of the system tends more towards “efficient”. On the contrary, the qualitative results show that the tool requires too much effort.
It is unclear whether this is due to the template itself or the implementation in the interface.
Limitations
The results of the study must be interpreted with caution and cannot easily be generalized. This is due to the fact that the study was only conducted with a small sample, which must be taken into account for both the qualitative and quantitative results. Thus, the results of the UEQ-S were not used to generate generally valid findings, but rather to compare the statements of the participants with the quantitative tendencies.
It is also important to acknowledge that the tasks that were solved in the study only represent a hypothetical scenario that can hardly reflect the challenges of day-to-day design practice. Furthermore, the interactive prototype with its limited range of functions cannot fully represent a design system into which the concept would be integrated.
Learnings
Lack of task context might impact study result
Especially when confronting participants with complex tasks during a user study, a scenario description, for example, should be provided so that they can empathize with the context.
Diversify the sample
It was noticeable that the views and statements varied greatly depending on how much professional experience the participants had. While more experienced designers tended to argue pragmatically, novices were more easily enthused by the topic.
Do not pre-fill input fields
At the moment it is not possible to integrate interactive input fields in Figma without further ado. One attempt was to pre-fill the fields with one click. However, this resulted in the participants focussing too much on the predefined content and losing focus on their own points.
There's more to it
This article only scratches the surface of the thoughts and actions behind what was realised in the project. Let's talk if you're interested in more details!